seaborn.set_theme#
- seaborn.set_theme(context='notebook', style='darkgrid', palette='deep', font='sans-serif', font_scale=1, color_codes=True, rc=None)#
Set aspects of the visual theme for all matplotlib and seaborn plots.
This function changes the global defaults for all plots using the matplotlib rcParams system. The themeing is decomposed into several distinct sets of parameter values.
The options are illustrated in the aesthetics and color palette tutorials.
- Parameters:
- contextstring or dict
Scaling parameters, see
plotting_context().- stylestring or dict
Axes style parameters, see
axes_style().- palettestring or sequence
Color palette, see
color_palette().- fontstring
Font family, see matplotlib font manager.
- font_scalefloat, optional
Separate scaling factor to independently scale the size of the font elements.
- color_codesbool
If
Trueandpaletteis a seaborn palette, remap the shorthand color codes (e.g. “b”, “g”, “r”, etc.) to the colors from this palette.- rcdict or None
Dictionary of rc parameter mappings to override the above.
Examples
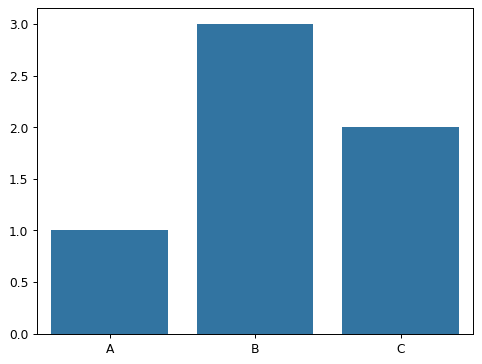
By default, seaborn plots will be made with the current values of the matplotlib rcParams:
sns.barplot(x=["A", "B", "C"], y=[1, 3, 2])
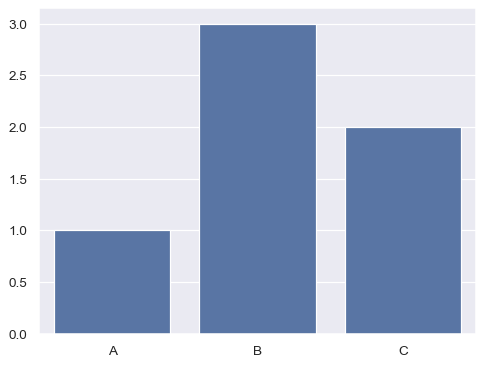
Calling this function with no arguments will activate seaborn’s “default” theme:
sns.set_theme()
sns.barplot(x=["A", "B", "C"], y=[1, 3, 2])
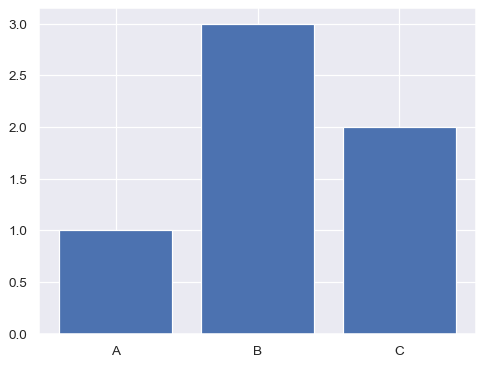
Note that this will take effect for all matplotlib plots, including those not made using seaborn:
plt.bar(["A", "B", "C"], [1, 3, 2])
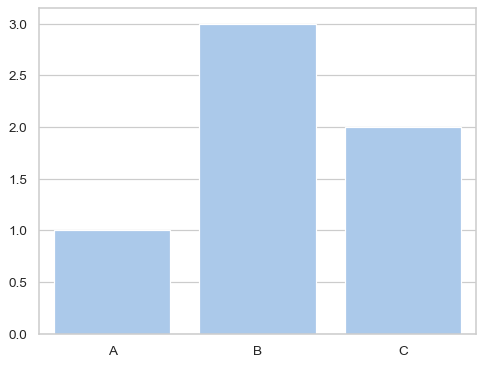
The seaborn theme is decomposed into several distinct sets of parameters that you can control independently:
sns.set_theme(style="whitegrid", palette="pastel")
sns.barplot(x=["A", "B", "C"], y=[1, 3, 2])
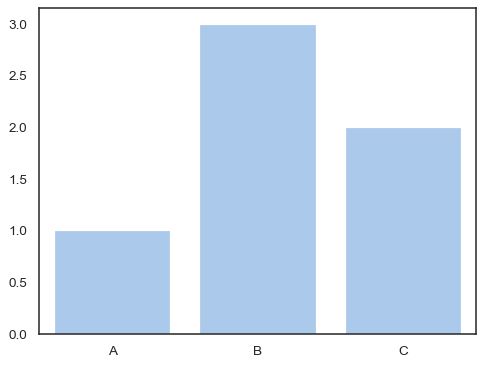
Pass
Noneto preserve the current values for a given set of parameters:sns.set_theme(style="white", palette=None) sns.barplot(x=["A", "B", "C"], y=[1, 3, 2])
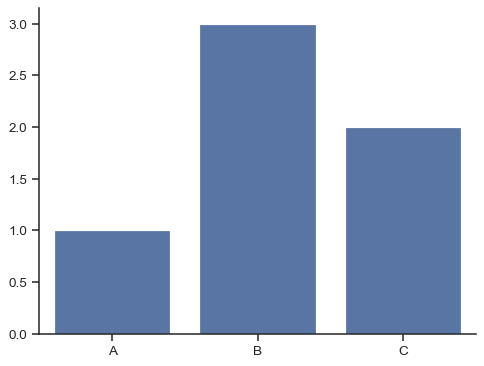
You can also override any seaborn parameters or define additional parameters that are part of the matplotlib rc system but not included in the seaborn themes:
custom_params = {"axes.spines.right": False, "axes.spines.top": False}
sns.set_theme(style="ticks", rc=custom_params)
sns.barplot(x=["A", "B", "C"], y=[1, 3, 2])