seaborn.objects.Dot#
- class seaborn.objects.Dot(artist_kws=<factory>, marker=<'o'>, pointsize=<6>, stroke=<0.75>, color=<'C0'>, alpha=<1>, fill=<True>, edgecolor=<depend:color>, edgealpha=<depend:alpha>, edgewidth=<0.5>, edgestyle=<'-'>)#
A mark suitable for dot plots or less-dense scatterplots.
- This mark defines the following properties:
marker, pointsize, stroke, color, alpha, fill, edgecolor, edgealpha, edgewidth, edgestyle
See also
DotsA dot mark defined by strokes to better handle overplotting.
Examples
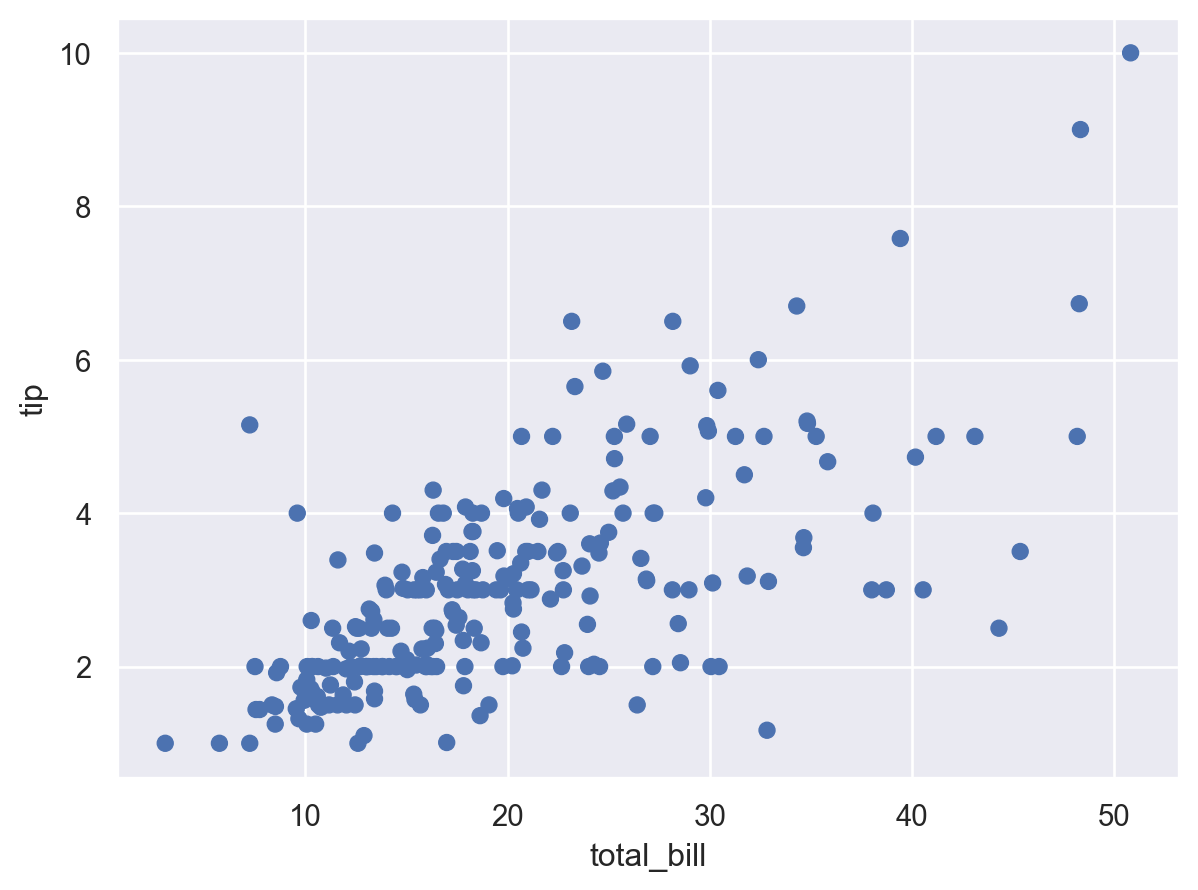
This mark draws relatively large, filled dots by default:
p1 = so.Plot(tips, "total_bill", "tip")
p1.add(so.Dot())
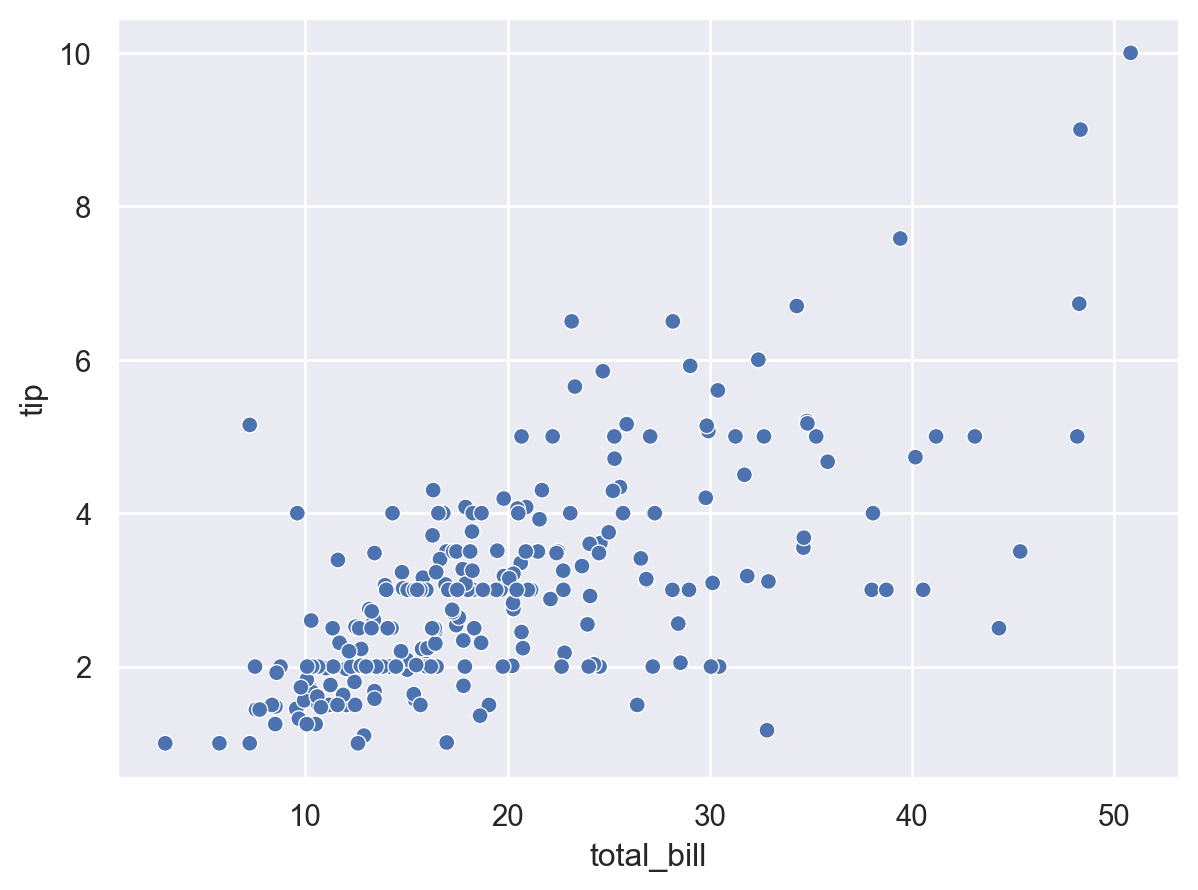
While
Dotsis a better choice for dense scatter plots, adding a thin edge can help to resolve individual points:p1.add(so.Dot(edgecolor="w"))
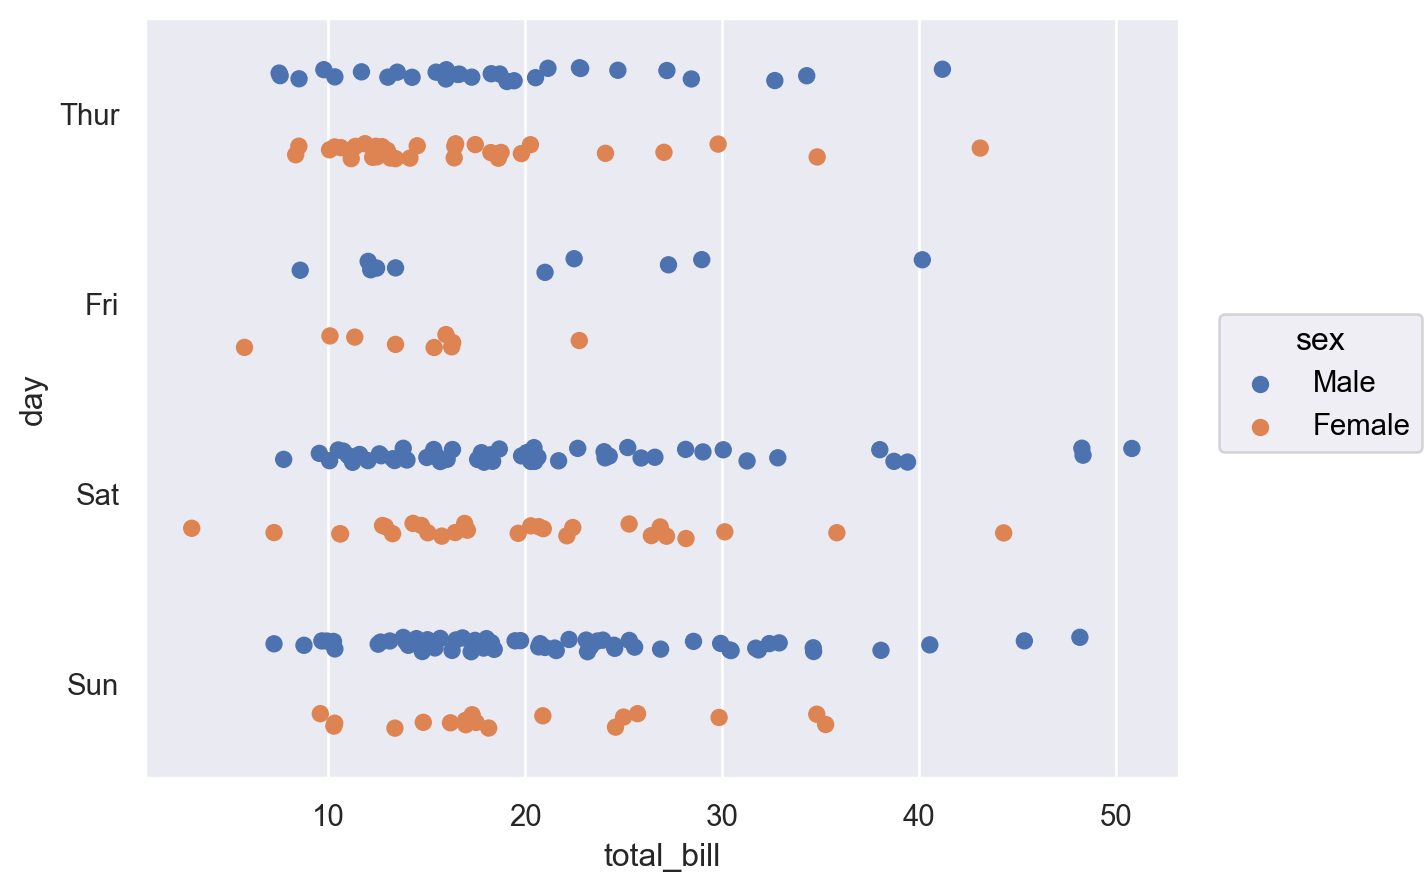
Dodging and jittering can also help to reduce overplotting, when appropriate:
(
    so.Plot(tips, "total_bill", "day", color="sex")
    .add(so.Dot(), so.Dodge(), so.Jitter(.2))
)
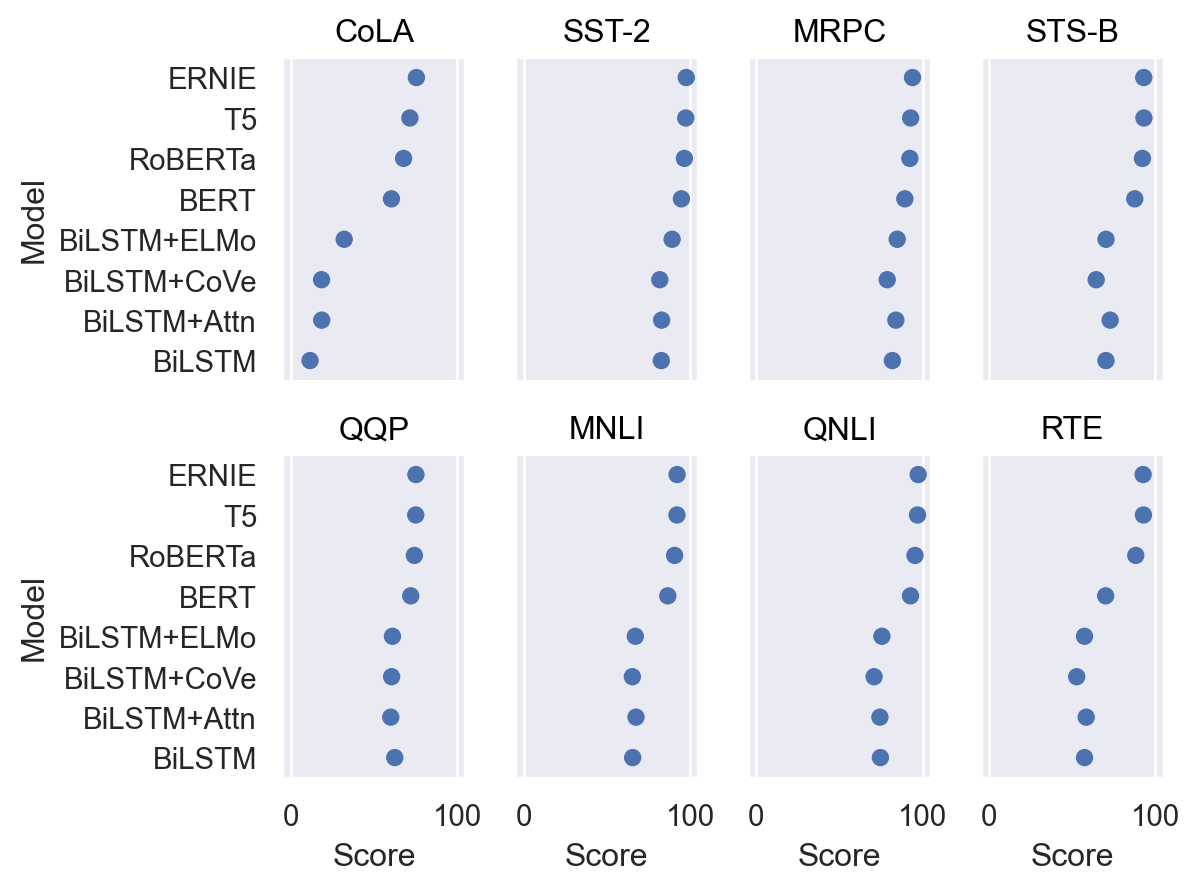
The larger dot size makes this mark well suited to representing values along a nominal scale:
p2 = so.Plot(glue, "Score", "Model").facet("Task", wrap=4).limit(x=(-5, 105))
p2.add(so.Dot())
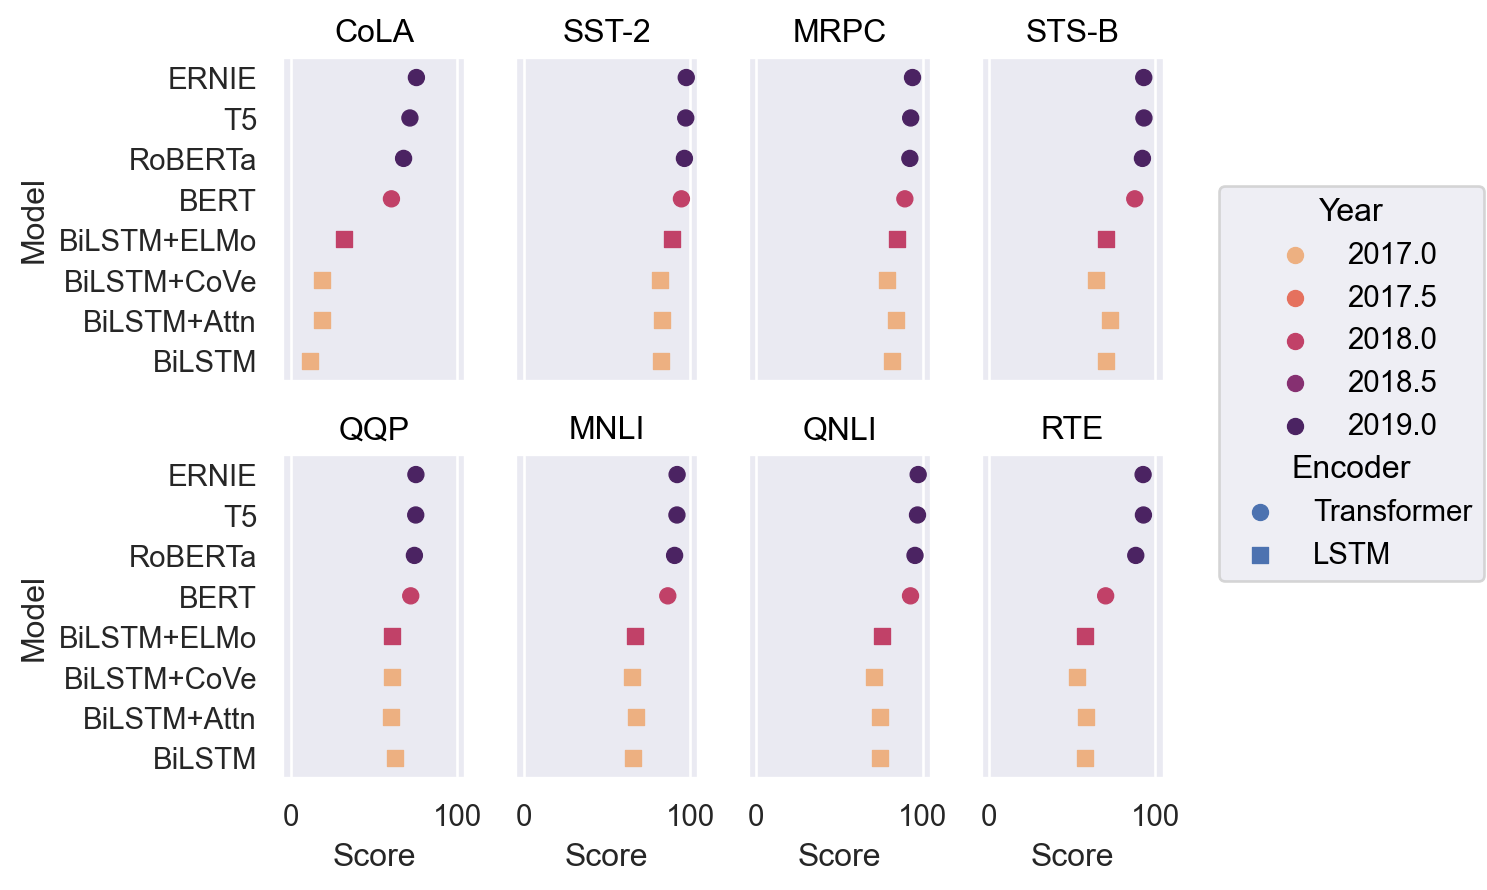
A number of properties can be set or mapped:
(
    p2
    .add(so.Dot(pointsize=6), color="Year", marker="Encoder")
    .scale(marker=["o", "s"], color="flare")
)
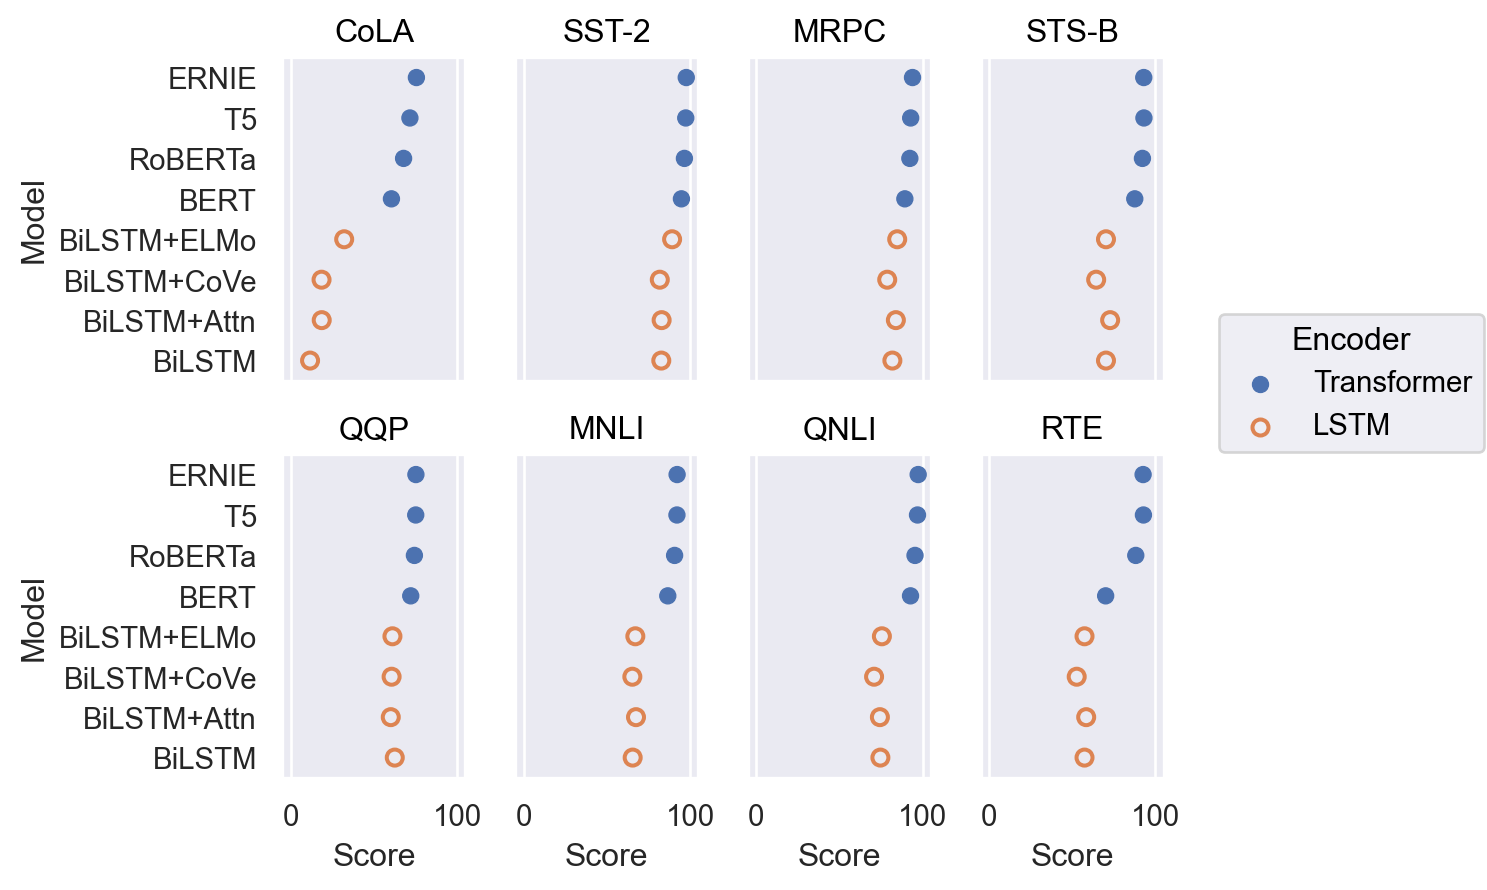
Note that the edge properties are parameterized differently for filled and unfilled markers; use
strokeandcolorrather thanedgewidthandedgecolorif the marker is unfilled:p2.add(so.Dot(stroke=1.5), fill="Encoder", color="Encoder")
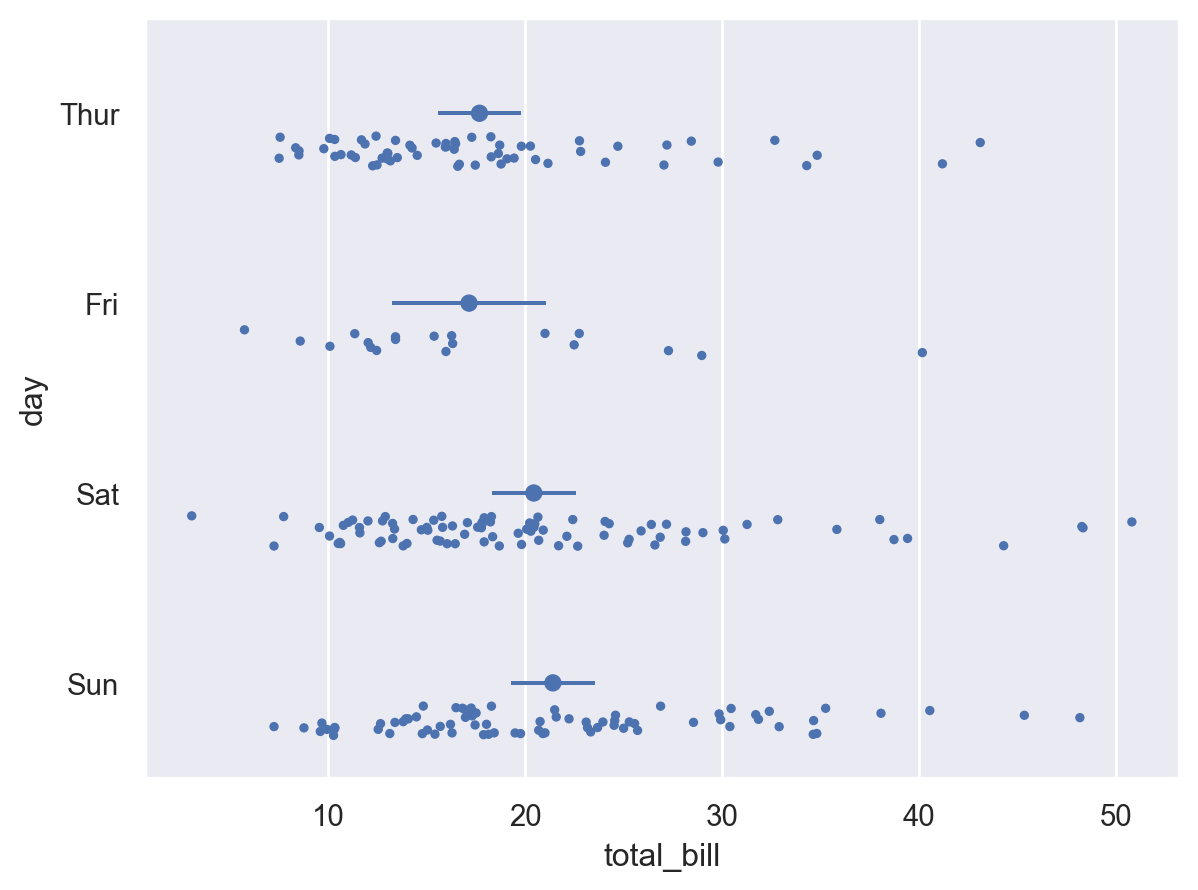
Combine with
Rangeto show error bars:( so.Plot(tips, x="total_bill", y="day") .add(so.Dot(pointsize=3), so.Shift(y=.2), so.Jitter(.2)) .add(so.Dot(), so.Agg()) .add(so.Range(), so.Est(errorbar=("se", 2))) )