seaborn.objects.Dash#
- class seaborn.objects.Dash(artist_kws=<factory>, color=<'C0'>, alpha=<1>, linewidth=<rc:lines.linewidth>, linestyle=<rc:lines.linestyle>, width=<0.8>)#
A line mark drawn as an oriented segment for each datapoint.
Examples
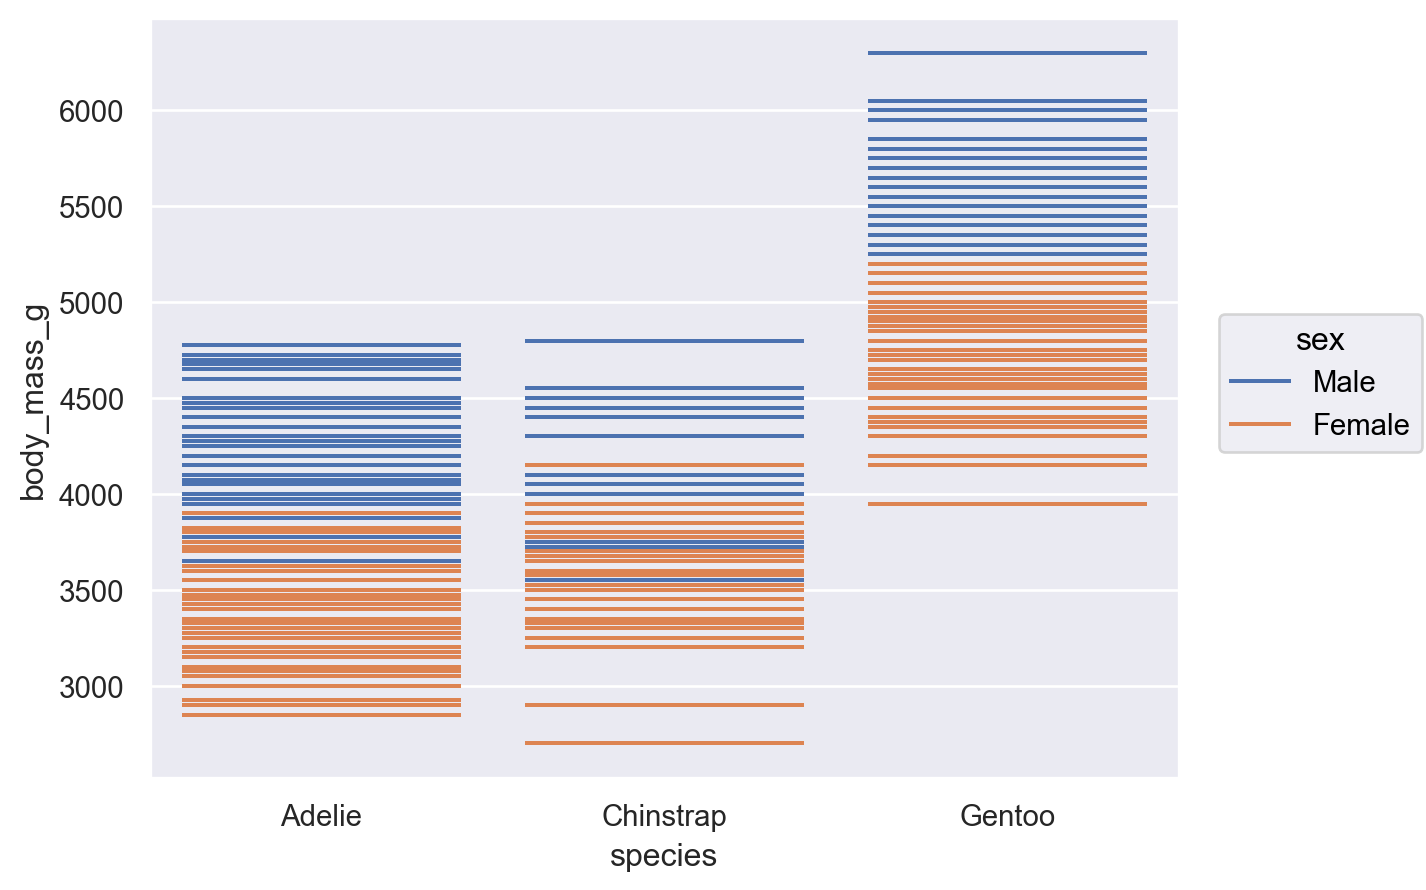
A line segment is drawn for each datapoint, centered on the value along the orientation axis:
p = so.Plot(penguins, "species", "body_mass_g", color="sex")
p.add(so.Dash())
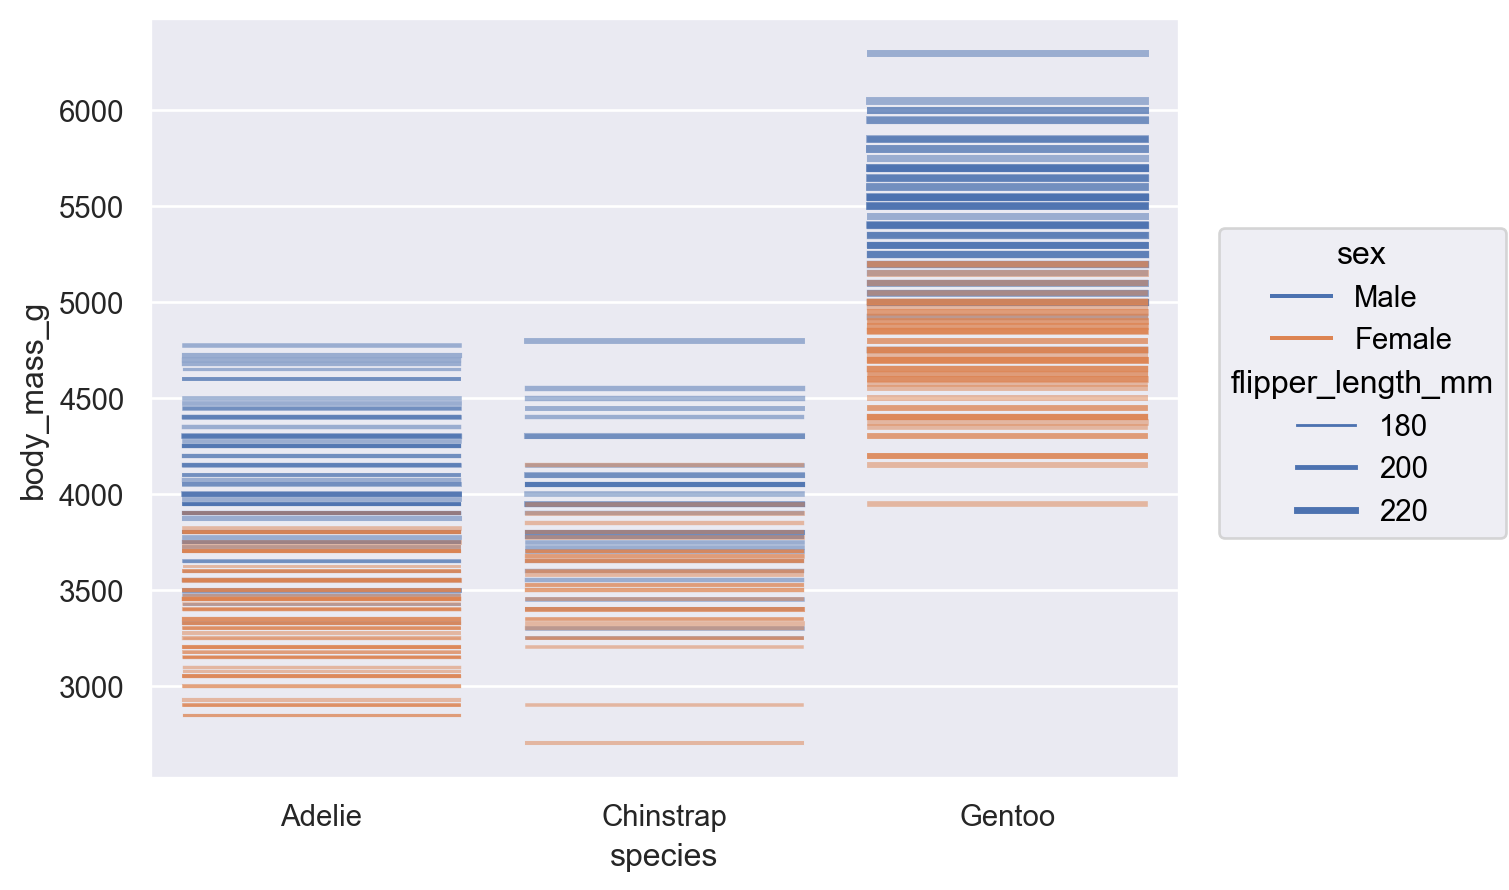
A number of properties can be mapped or set directly:
p.add(so.Dash(alpha=.5), linewidth="flipper_length_mm")
The mark has a
widthproperty, which is relative to the spacing between orientation values:p.add(so.Dash(width=.5))

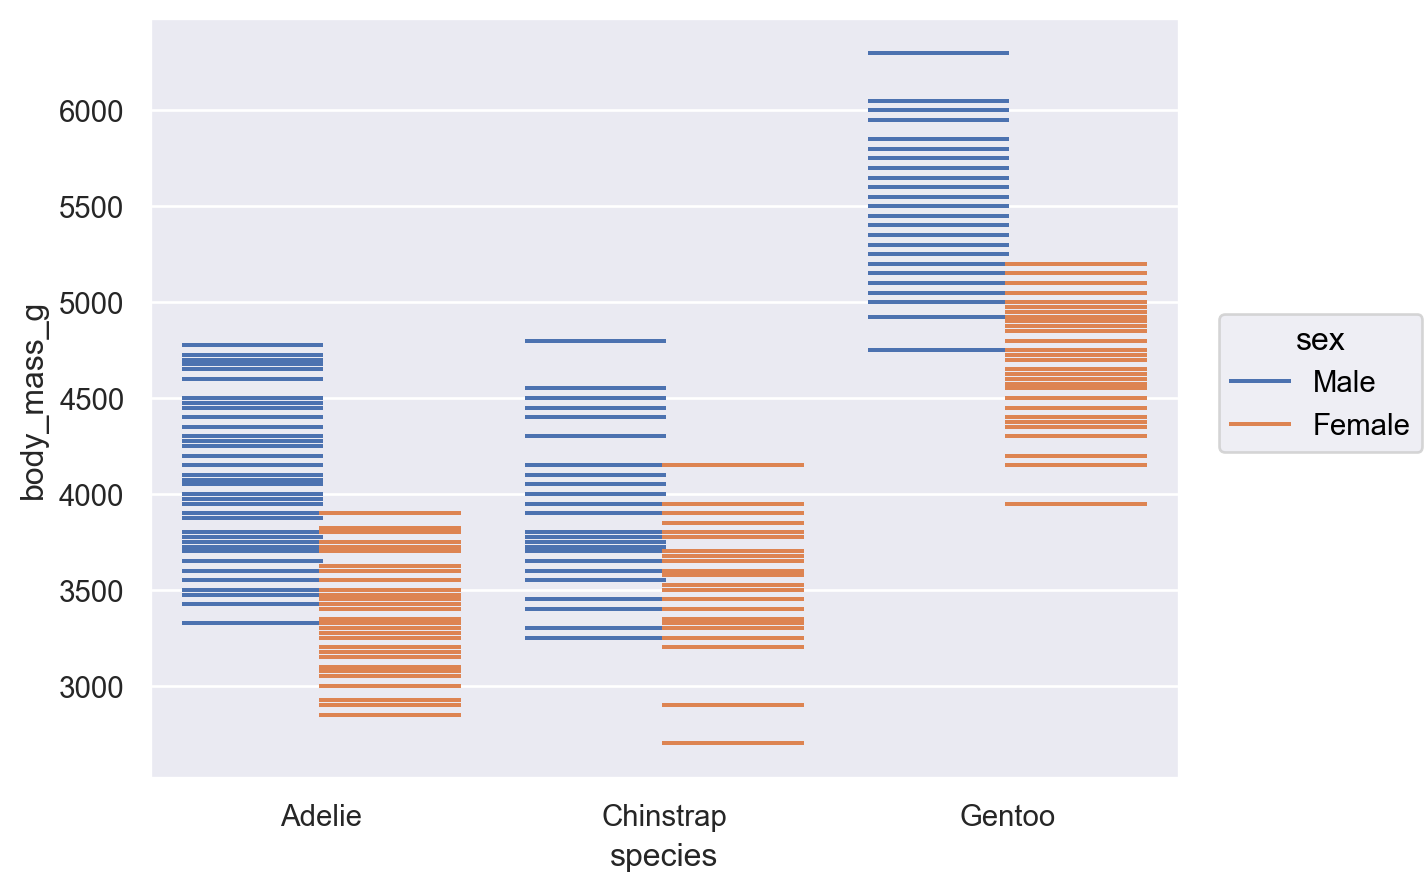
When dodged, the width will automatically adapt:
p.add(so.Dash(), so.Dodge())
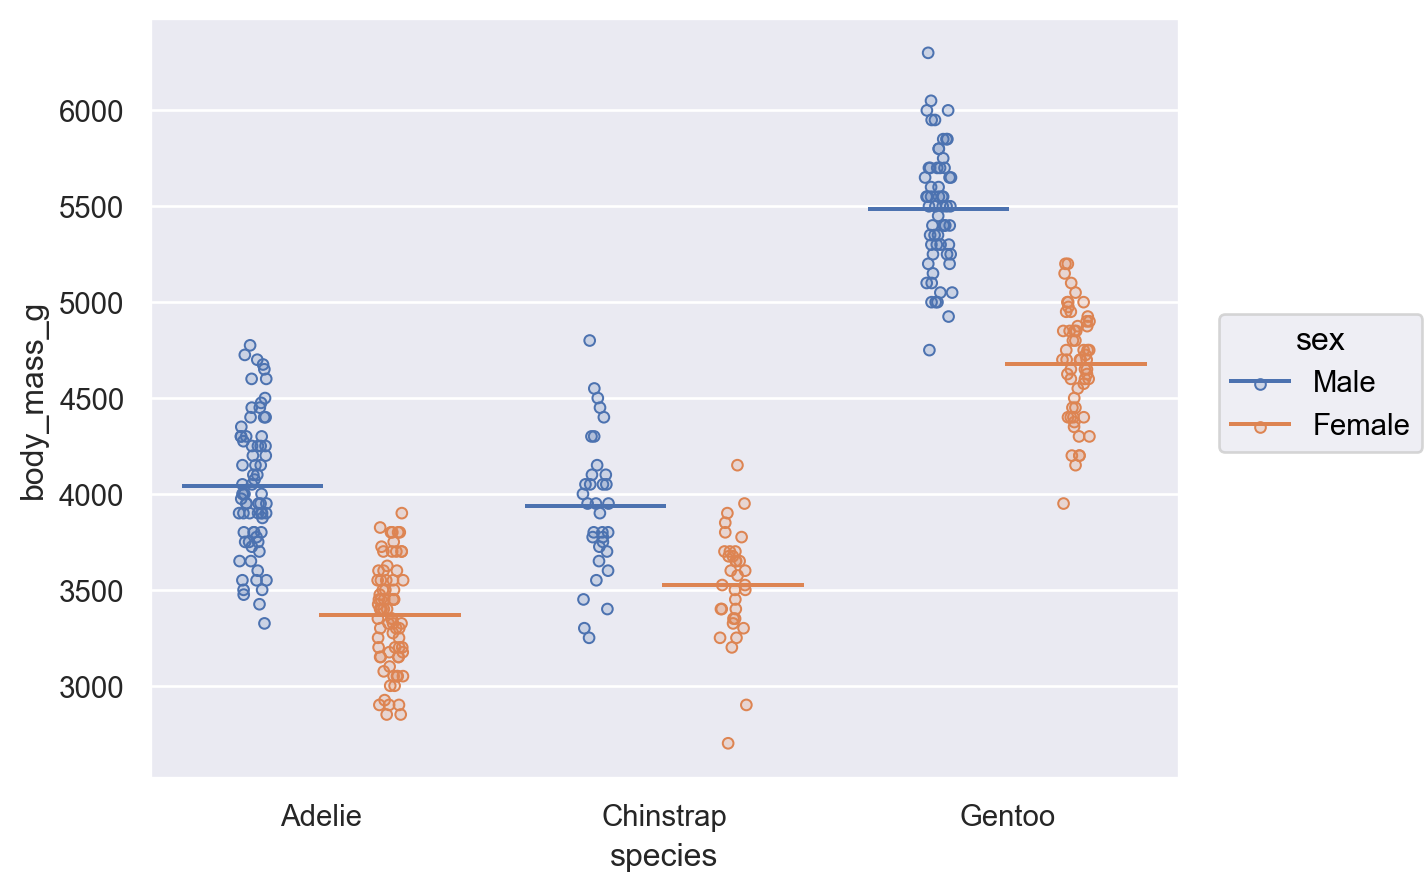
This mark works well to show aggregate values when paired with a strip plot:
(
    p
    .add(so.Dash(), so.Agg(), so.Dodge())
    .add(so.Dots(), so.Dodge(), so.Jitter())
)
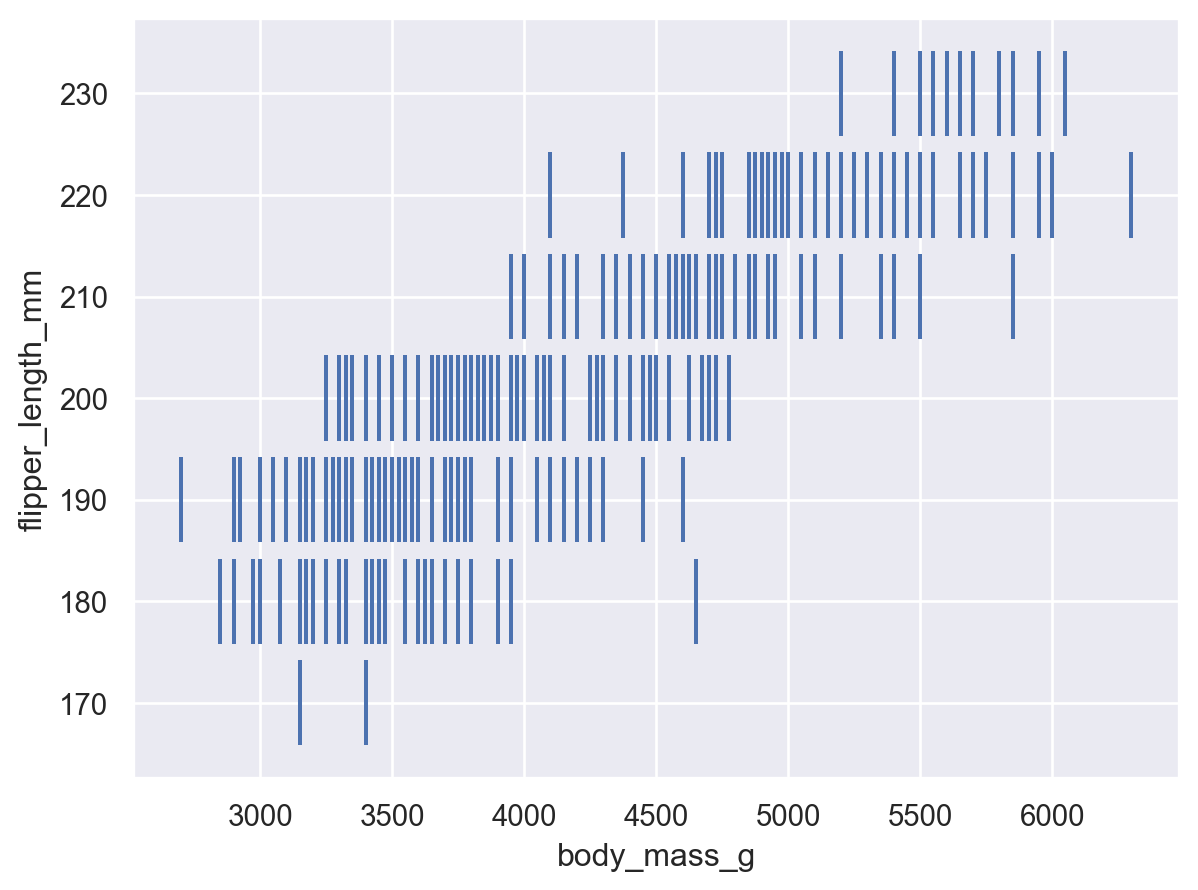
When both coordinate variables are numeric, you can control the orientation explicitly:
(
    so.Plot(
        penguins["body_mass_g"],
        penguins["flipper_length_mm"].round(-1),
    )
    .add(so.Dash(), orient="y")
)