seaborn.objects.Plot.limit#
- Plot.limit(**limits)#
Control the range of visible data.
Keywords correspond to variables defined in the plot, and values are a
(min, max)tuple (where either can beNoneto leave unset).Limits apply only to the axis; data outside the visible range are still used for any stat transforms and added to the plot.
Behavior for non-coordinate variables is currently undefined.
Examples
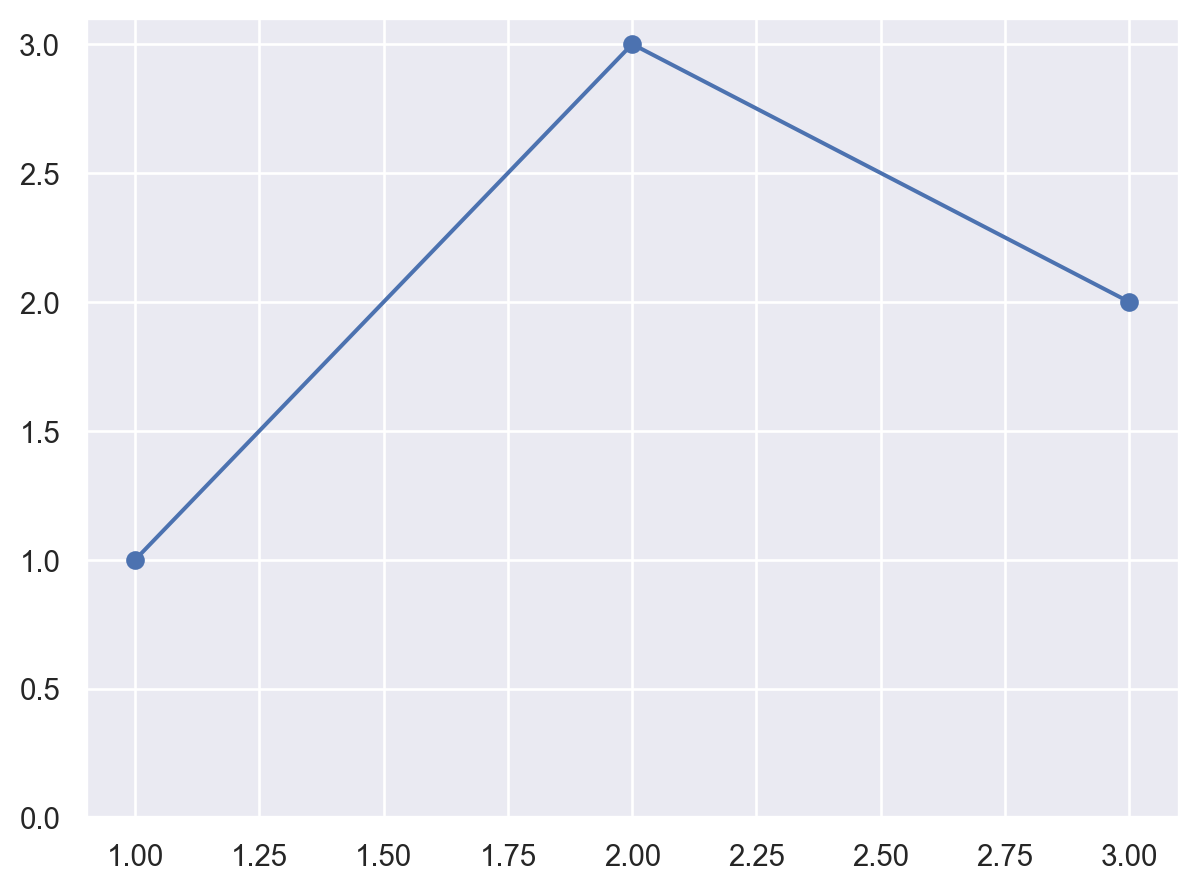
By default, plot limits are automatically set to provide a small margin around the data (controlled by
Plot.theme()parametersaxes.xmarginandaxes.ymargin):p = so.Plot(x=[1, 2, 3], y=[1, 3, 2]).add(so.Line(marker="o")) p
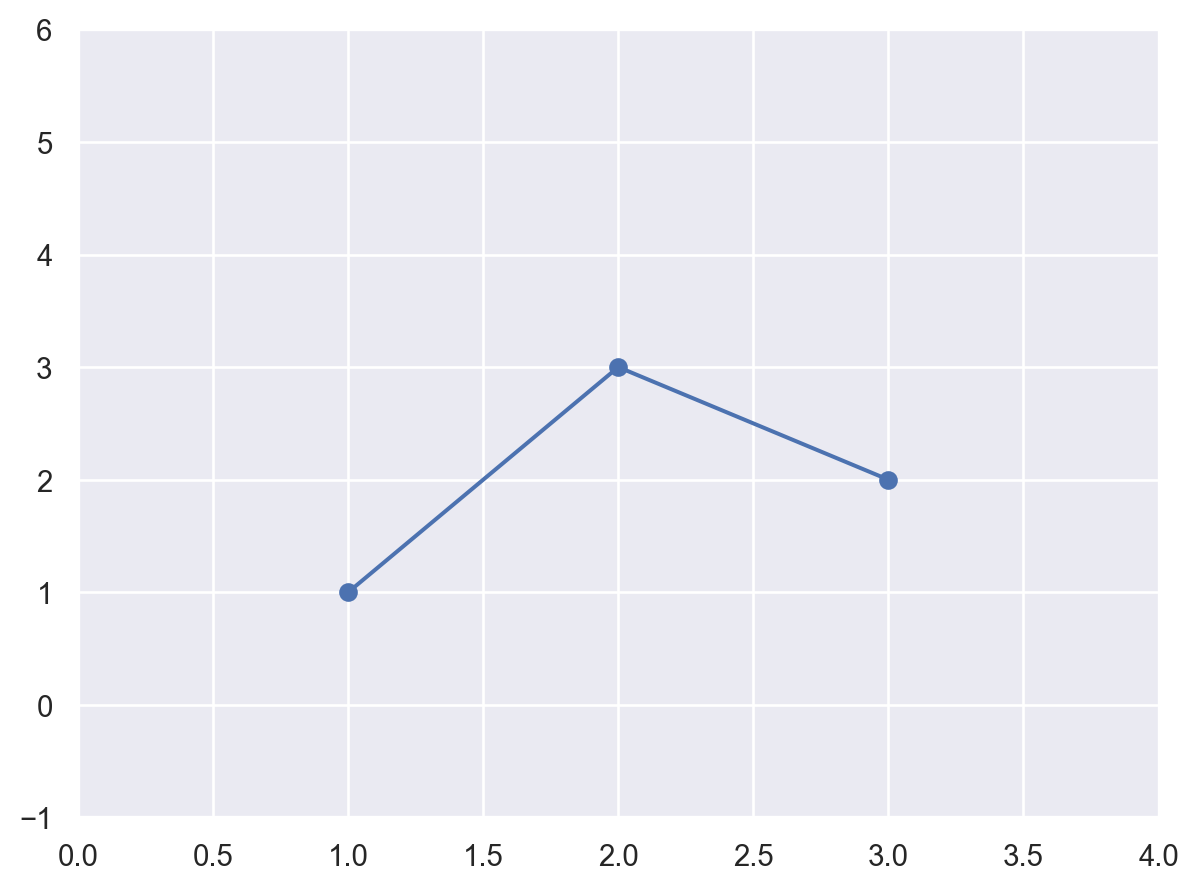
Pass a
min/maxtuple to pin the limits at specific values:p.limit(x=(0, 4), y=(-1, 6))
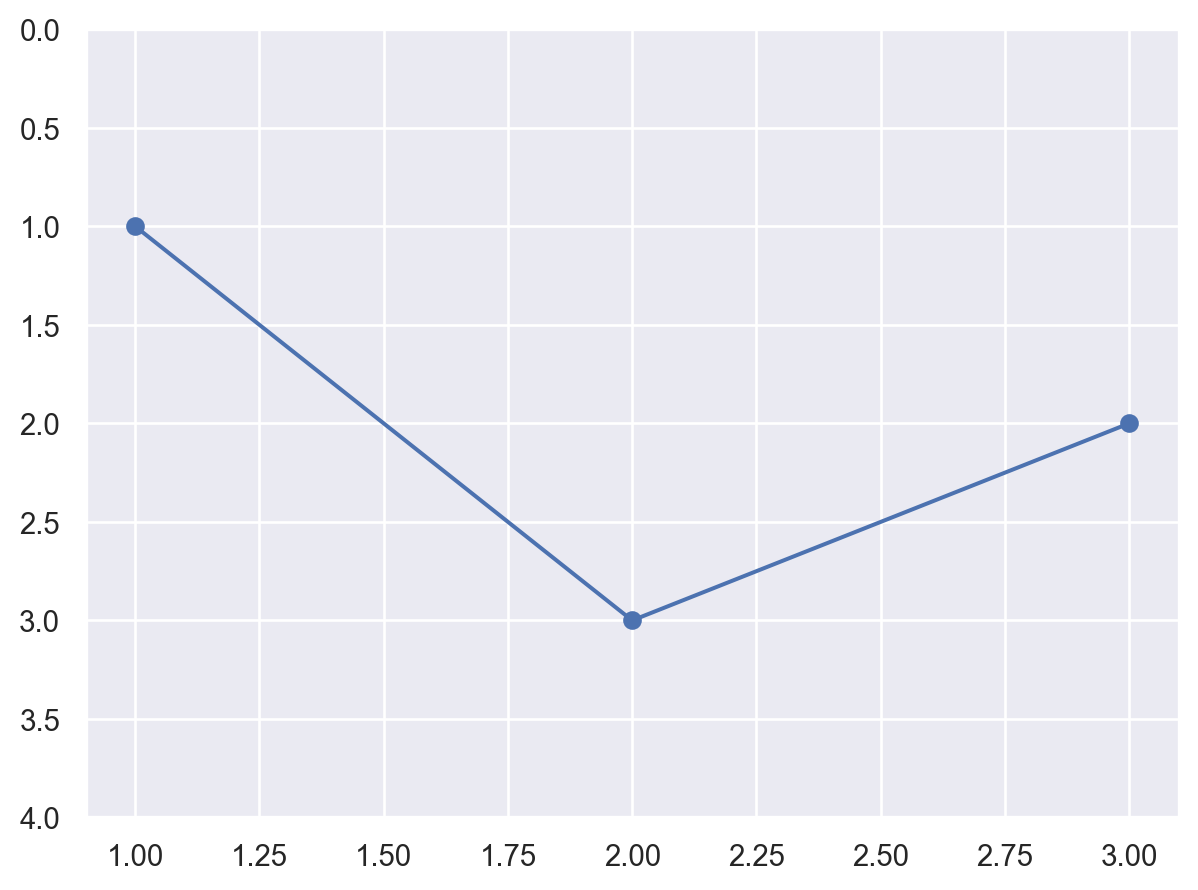
Reversing the
min/maxvalues will invert the axis:p.limit(y=(4, 0))
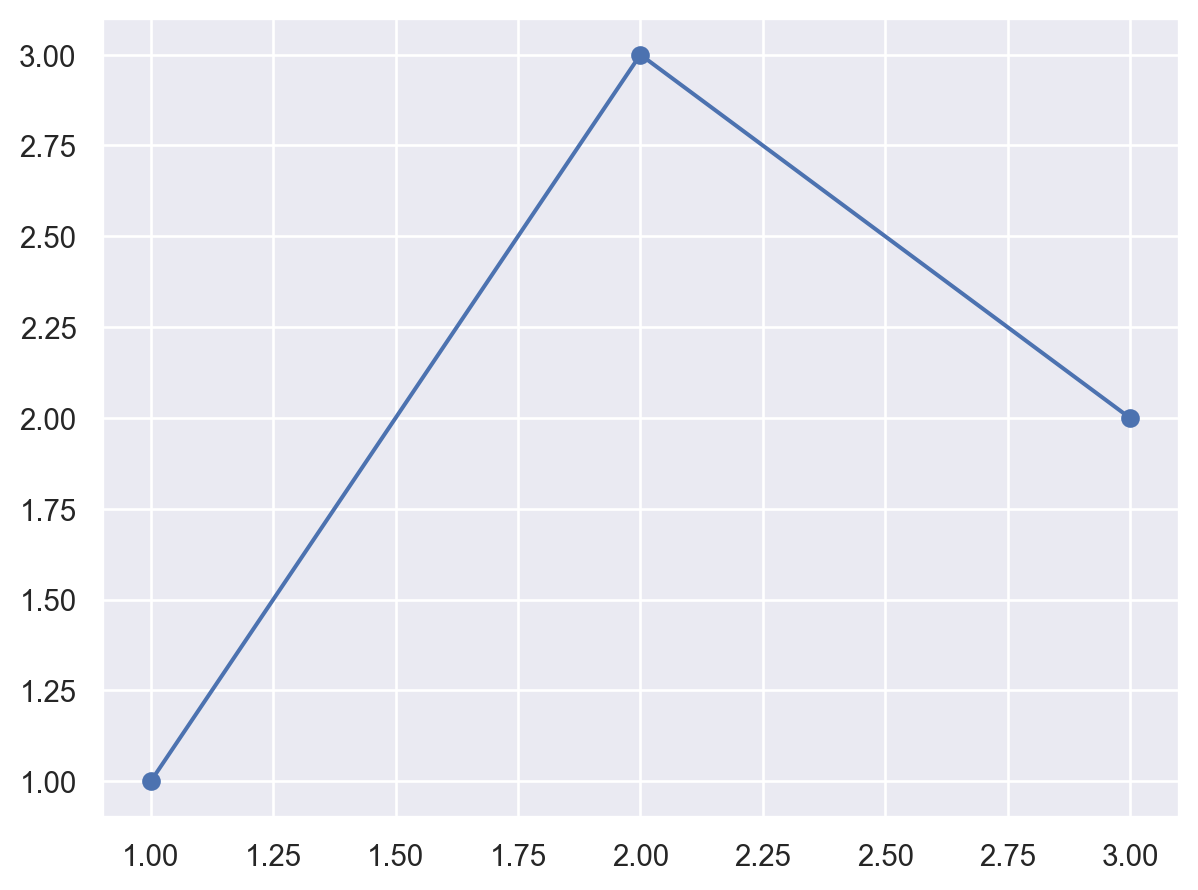
Use
Nonefor either side to maintain the default value:p.limit(y=(0, None))