seaborn.objects.Norm#
- class seaborn.objects.Norm(func='max', where=None, by=None, percent=False)#
Divisive scaling on the value axis after aggregating within groups.
- Parameters:
- funcstr or callable
Function called on each group to define the comparison value.
- wherestr
Query string defining the subset used to define the comparison values.
- bylist of variables
Variables used to define aggregation groups.
- percentbool
If True, multiply the result by 100.
Examples
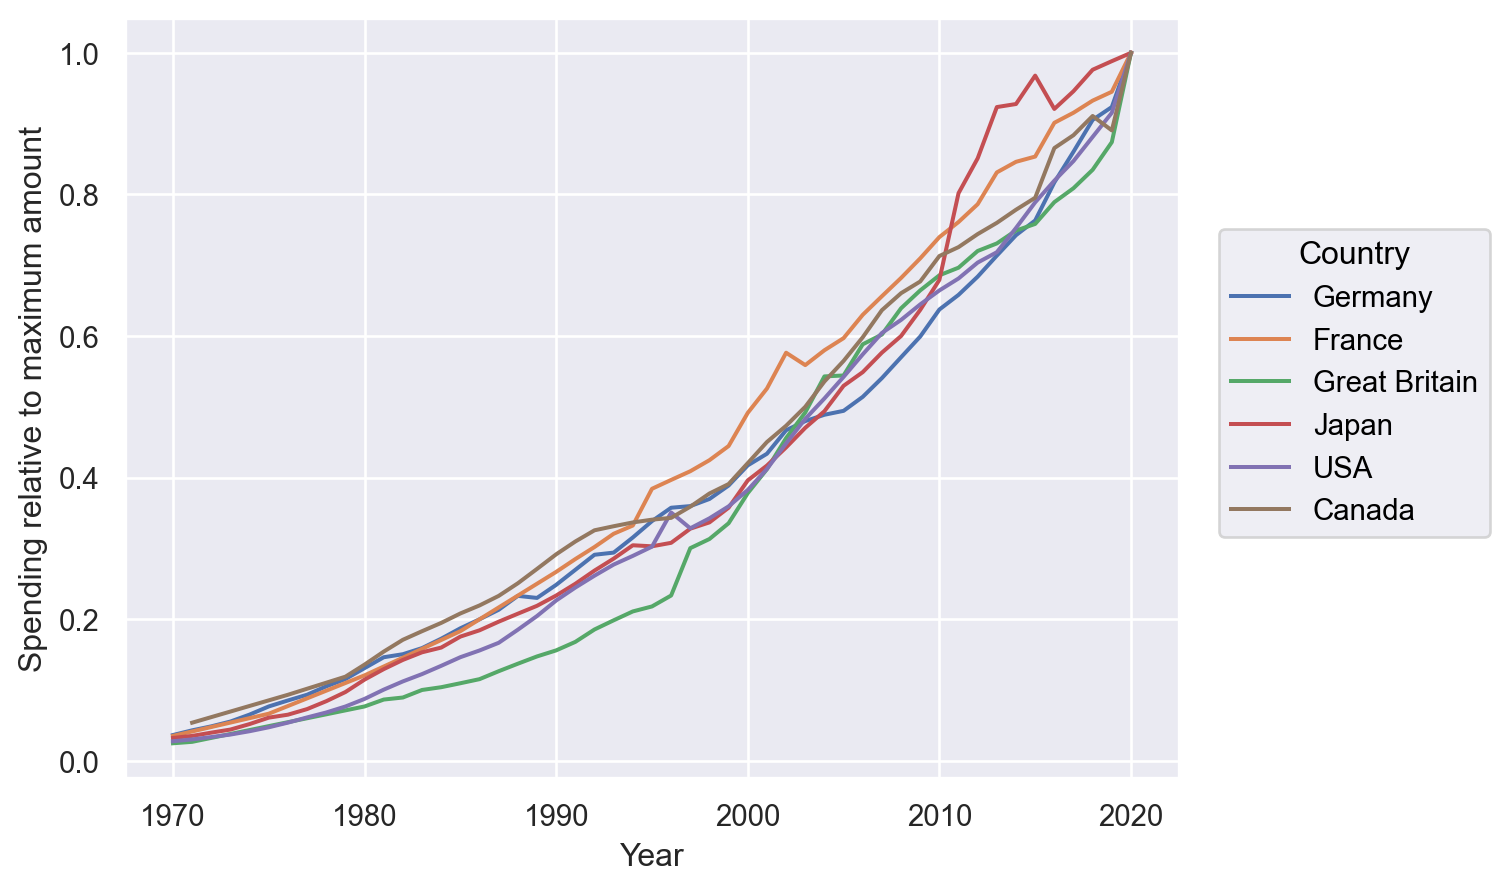
By default, this transform scales each group relative to its maximum value:
(
    so.Plot(healthexp, x="Year", y="Spending_USD", color="Country")
    .add(so.Lines(), so.Norm())
    .label(y="Spending relative to maximum amount")
)
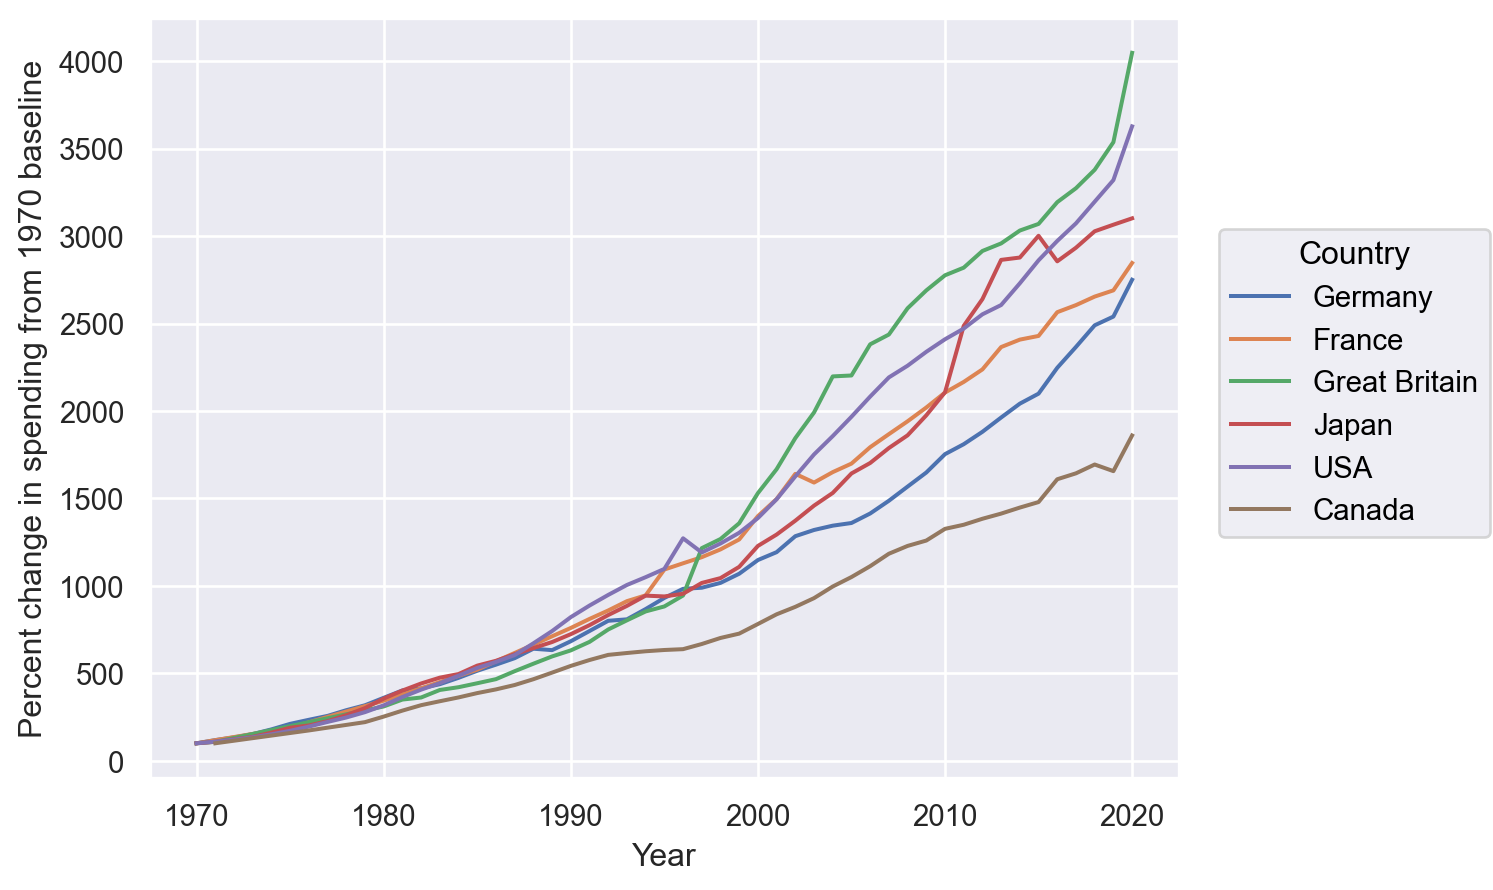
Use
whereto constrain the values used to define a baseline, andpercentto scale the output:( so.Plot(healthexp, x="Year", y="Spending_USD", color="Country") .add(so.Lines(), so.Norm(where="x == x.min()", percent=True)) .label(y="Percent change in spending from 1970 baseline") )