seaborn.objects.Plot.on#
- Plot.on(target)#
Provide existing Matplotlib figure or axes for drawing the plot.
When using this method, you will also need to explicitly call a method that triggers compilation, such as
Plot.show()orPlot.save(). If you want to postprocess using matplotlib, you’d need to callPlot.plot()first to compile the plot without rendering it.- Parameters:
- targetAxes, SubFigure, or Figure
Matplotlib object to use. Passing
matplotlib.axes.Axeswill add artists without otherwise modifying the figure. Otherwise, subplots will be created within the space of the givenmatplotlib.figure.Figureormatplotlib.figure.SubFigure.
Examples
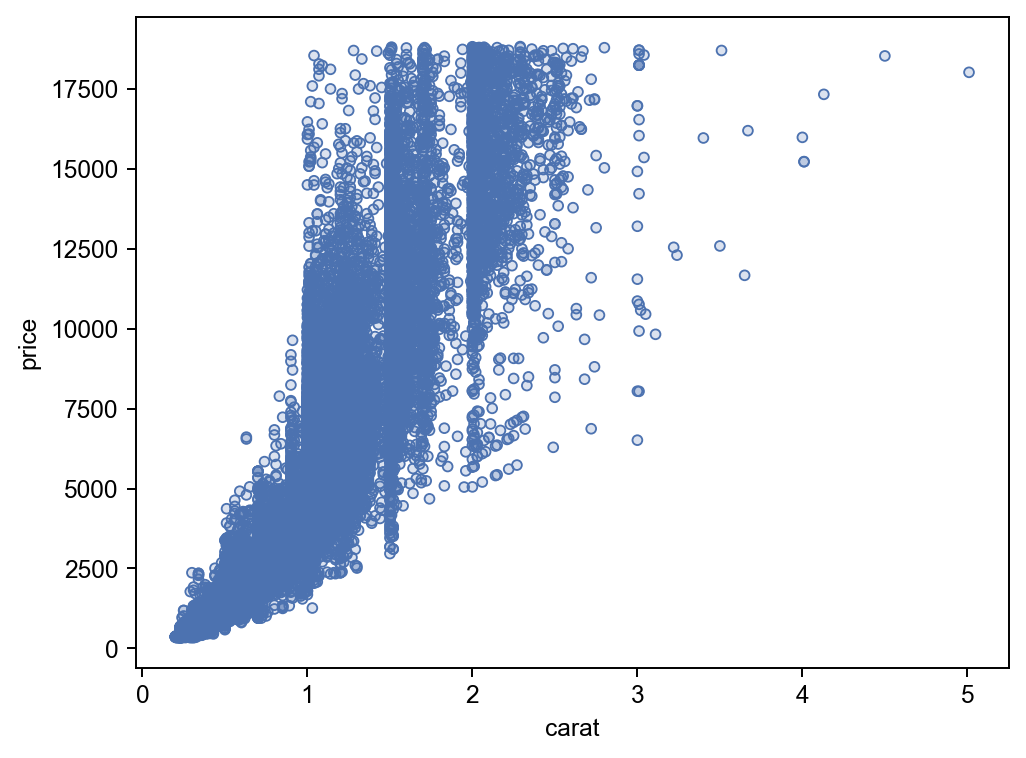
Passing a
matplotlib.axes.Axesobject provides functionality closest to seaborn’s axes-level plotting functions. Notice how the resulting image looks different from others created withPlot. This is because the plot theme uses the global rcParams at the time the axes were created, rather thanPlotdefaults:p = so.Plot(diamonds, "carat", "price").add(so.Dots()) f, ax = plt.subplots() p.on(ax).show()
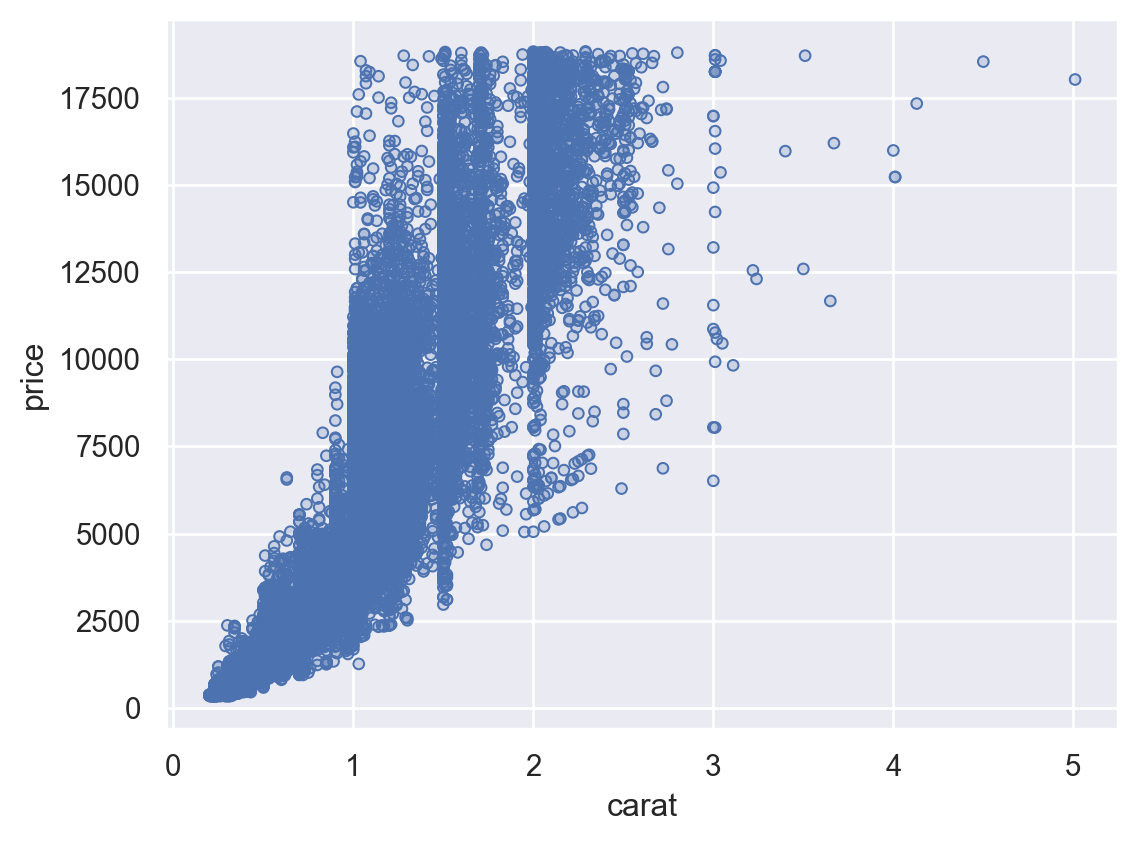
Alternatively, calling
matplotlib.pyplot.figure()will defer axes creation toPlot, which will apply the default theme (and any customizations specified withPlot.theme()):f = plt.figure() p.on(f).show()

Creating a
matplotlib.figure.Figureobject will bypasspyplotaltogether. This may be useful for embeddingPlotfigures in a GUI application:f = mpl.figure.Figure() p.on(f).plot()
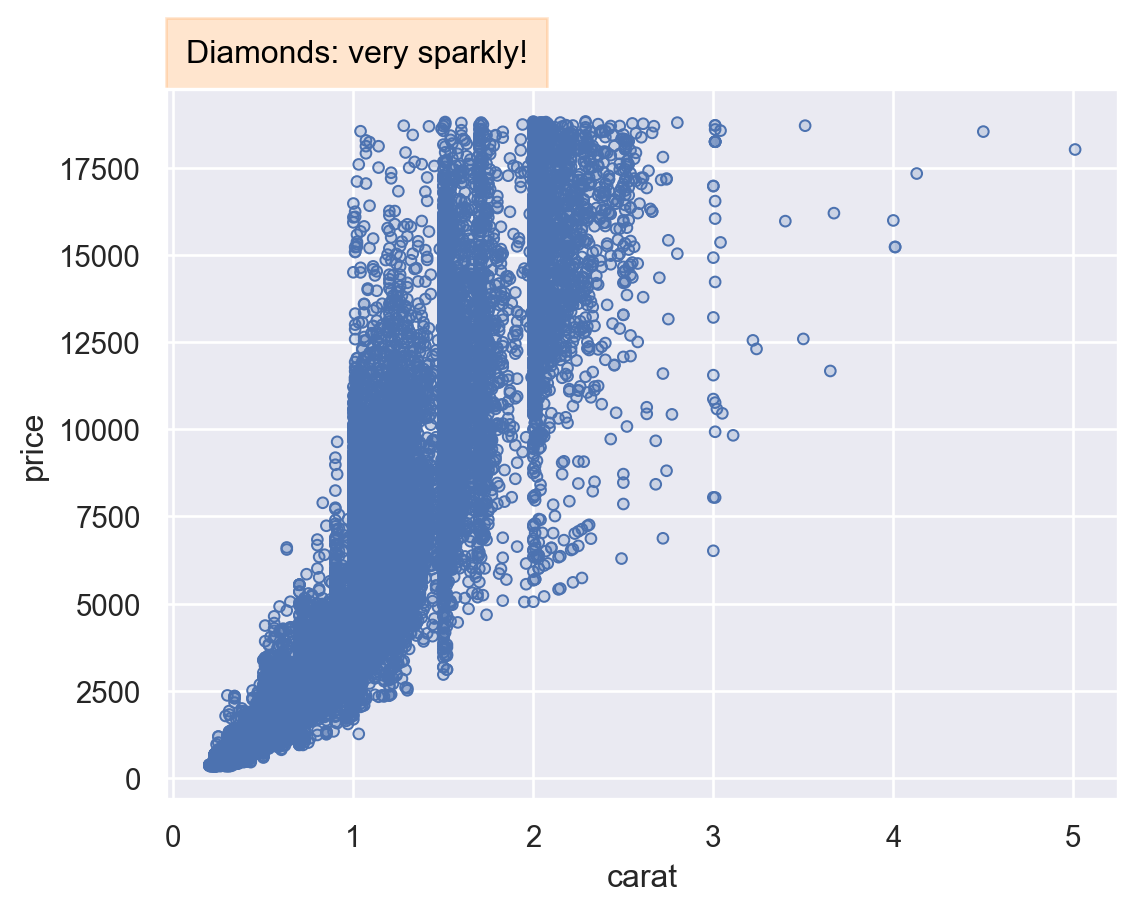
Using
Plot.onalso provides access to the underlying matplotlib objects, which may be useful for deep customization. But it requires a careful attention to the order of operations by which thePlotis specified, compiled, customized, and displayed:f = mpl.figure.Figure() res = p.on(f).plot() ax = f.axes[0] rect = mpl.patches.Rectangle( xy=(0, 1), width=.4, height=.1, color="C1", alpha=.2, transform=ax.transAxes, clip_on=False, ) ax.add_artist(rect) ax.text( x=rect.get_width() / 2, y=1 + rect.get_height() / 2, s="Diamonds: very sparkly!", size=12, ha="center", va="center", transform=ax.transAxes, ) res
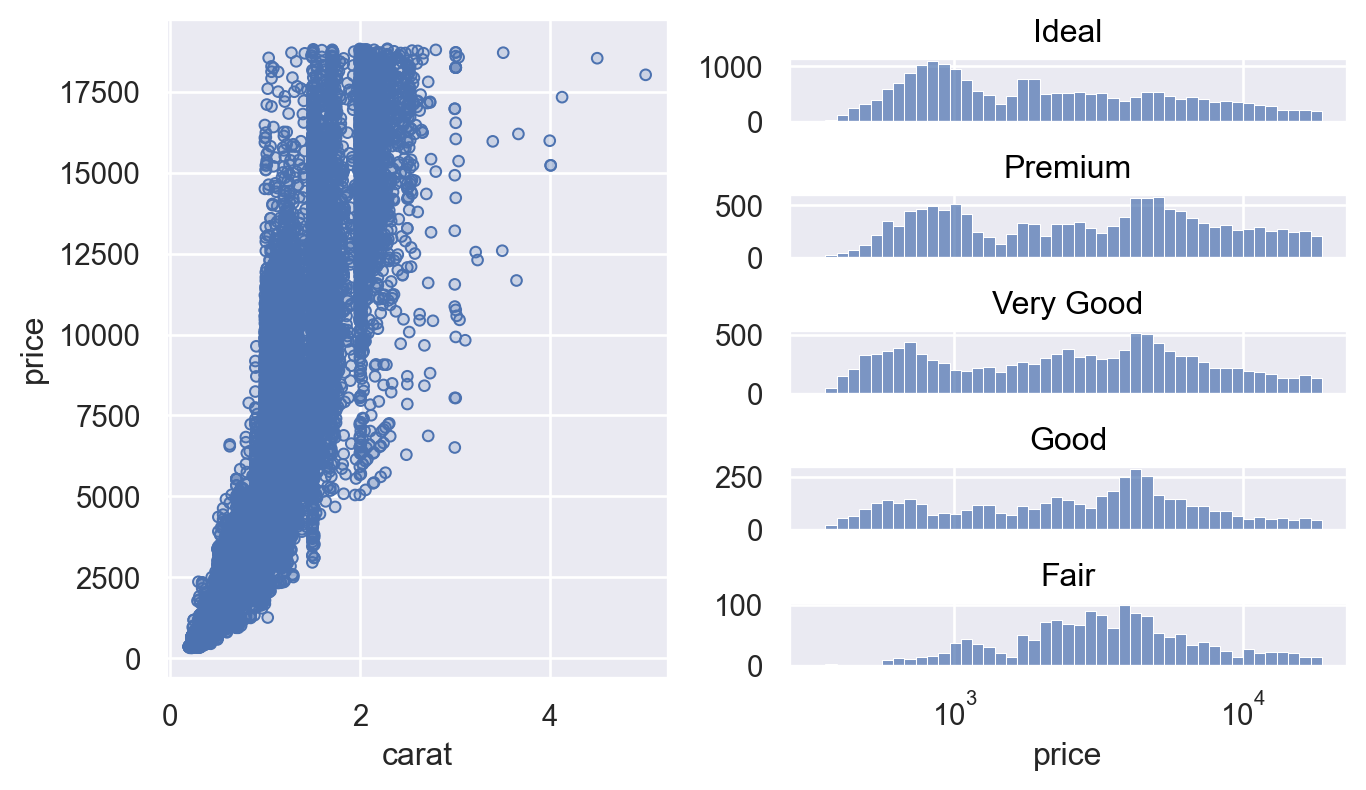
Matplotlib 3.4 introduced the concept of
matplotlib.figure.Figure.subfigures(), which make it easier to composite multiple arrangements of subplots. These can also be passed toPlot.on(),f = mpl.figure.Figure(figsize=(7, 4), dpi=100, layout="constrained") sf1, sf2 = f.subfigures(1, 2) p.on(sf1).plot() ( so.Plot(diamonds, x="price") .add(so.Bars(), so.Hist()) .facet(row="cut") .scale(x="log") .share(y=False) .on(sf2) )