seaborn.objects.Range#
- class seaborn.objects.Range(artist_kws=<factory>, color=<'C0'>, alpha=<1>, linewidth=<rc:lines.linewidth>, linestyle=<rc:lines.linestyle>)#
An oriented line mark drawn between min/max values.
Examples
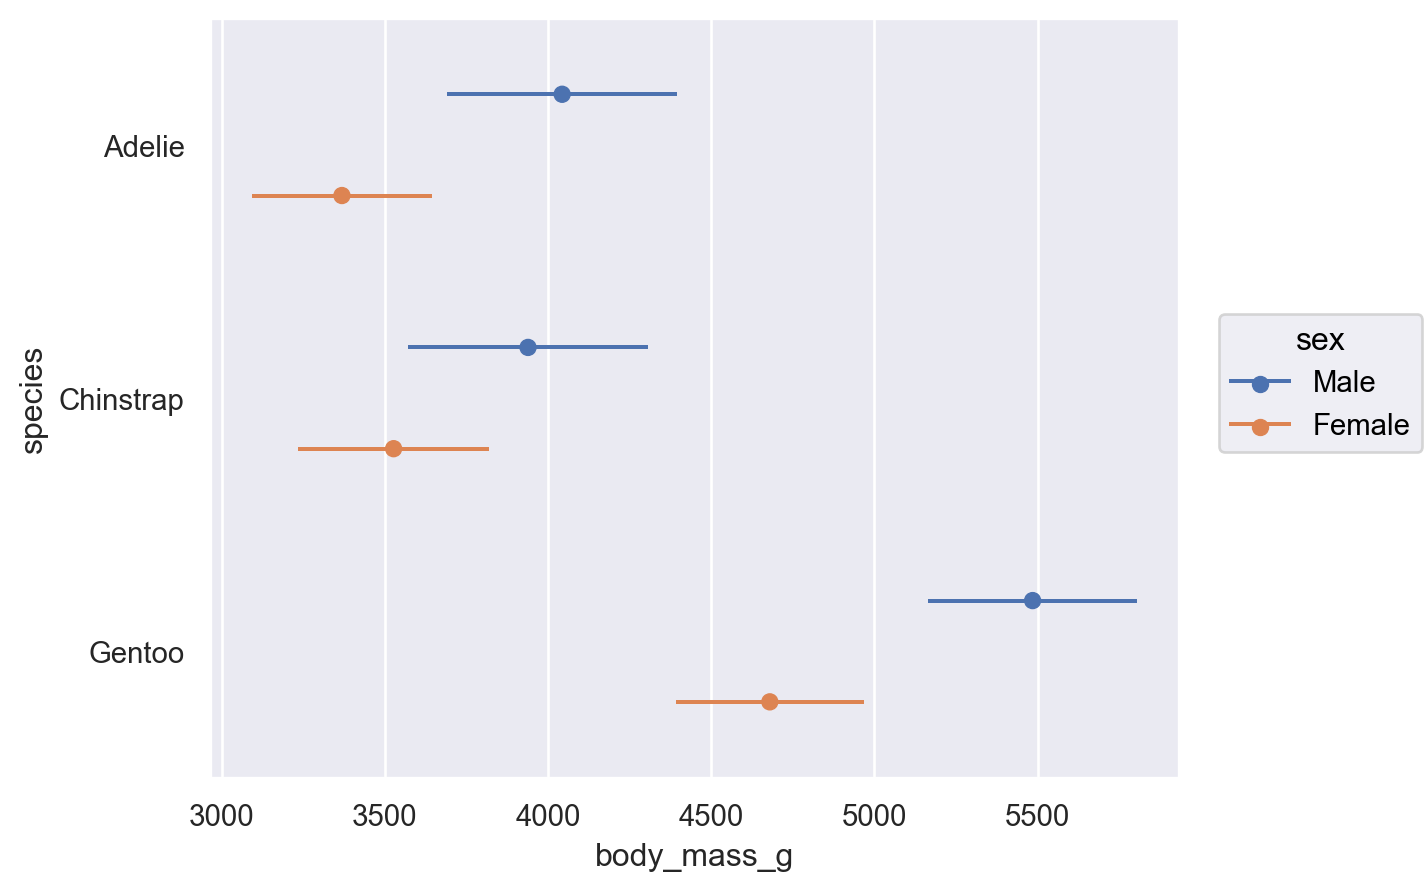
This mark will often be used in the context of a stat transform that adds an errorbar interval:
(
    so.Plot(penguins, x="body_mass_g", y="species", color="sex")
    .add(so.Dot(), so.Agg(), so.Dodge())
    .add(so.Range(), so.Est(errorbar="sd"), so.Dodge())
)
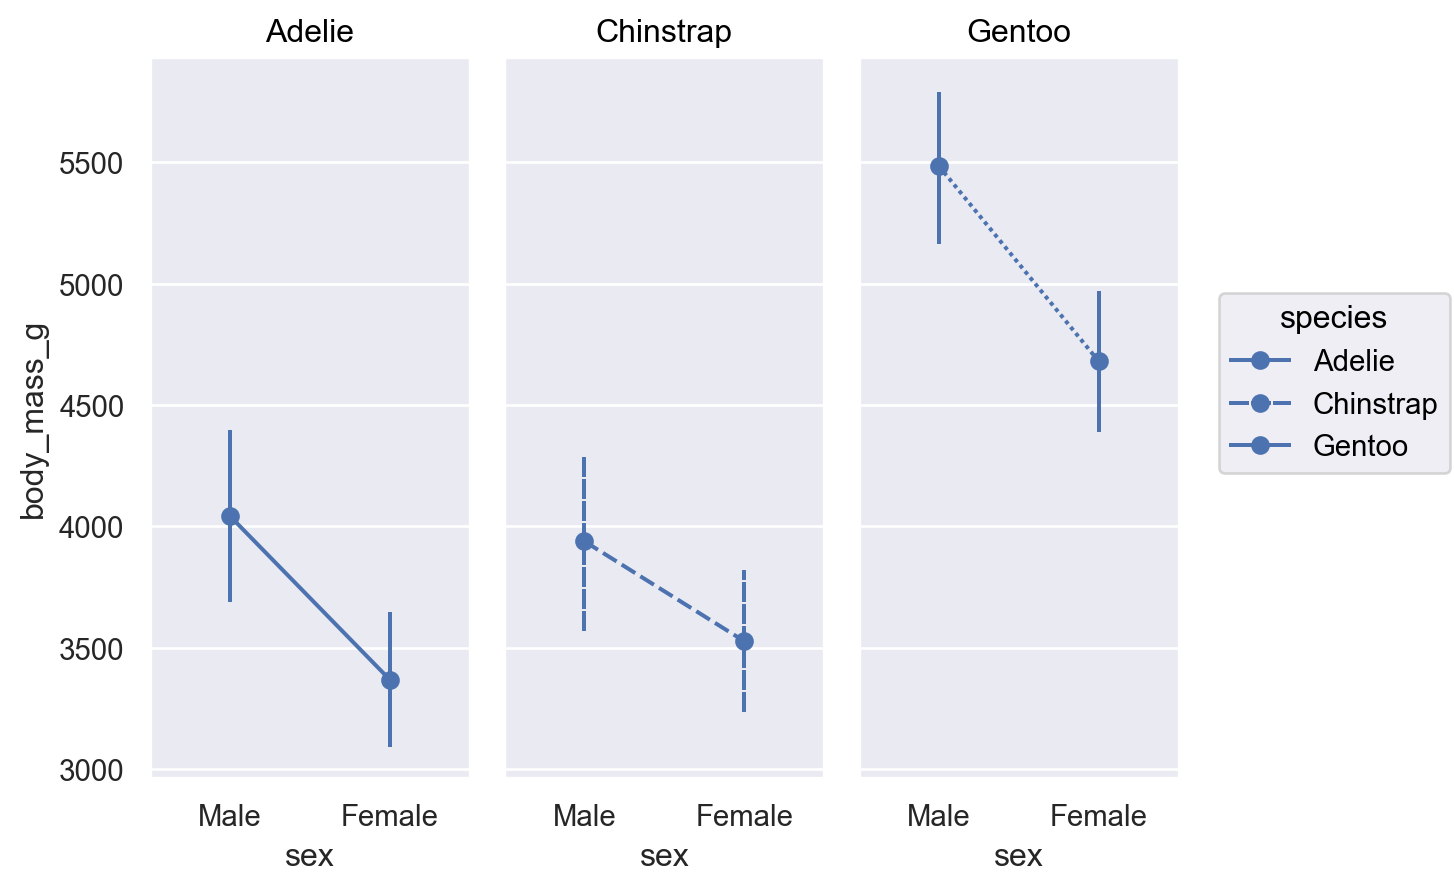
One feature (or potential gotcha) is that the mark will pick up properties like
linestyleandlinewidth; exclude those properties from the relevant layer if this behavior is undesired:( so.Plot(penguins, x="sex", y="body_mass_g", linestyle="species") .facet("species") .add(so.Line(marker="o"), so.Agg()) .add(so.Range(), so.Est(errorbar="sd")) )
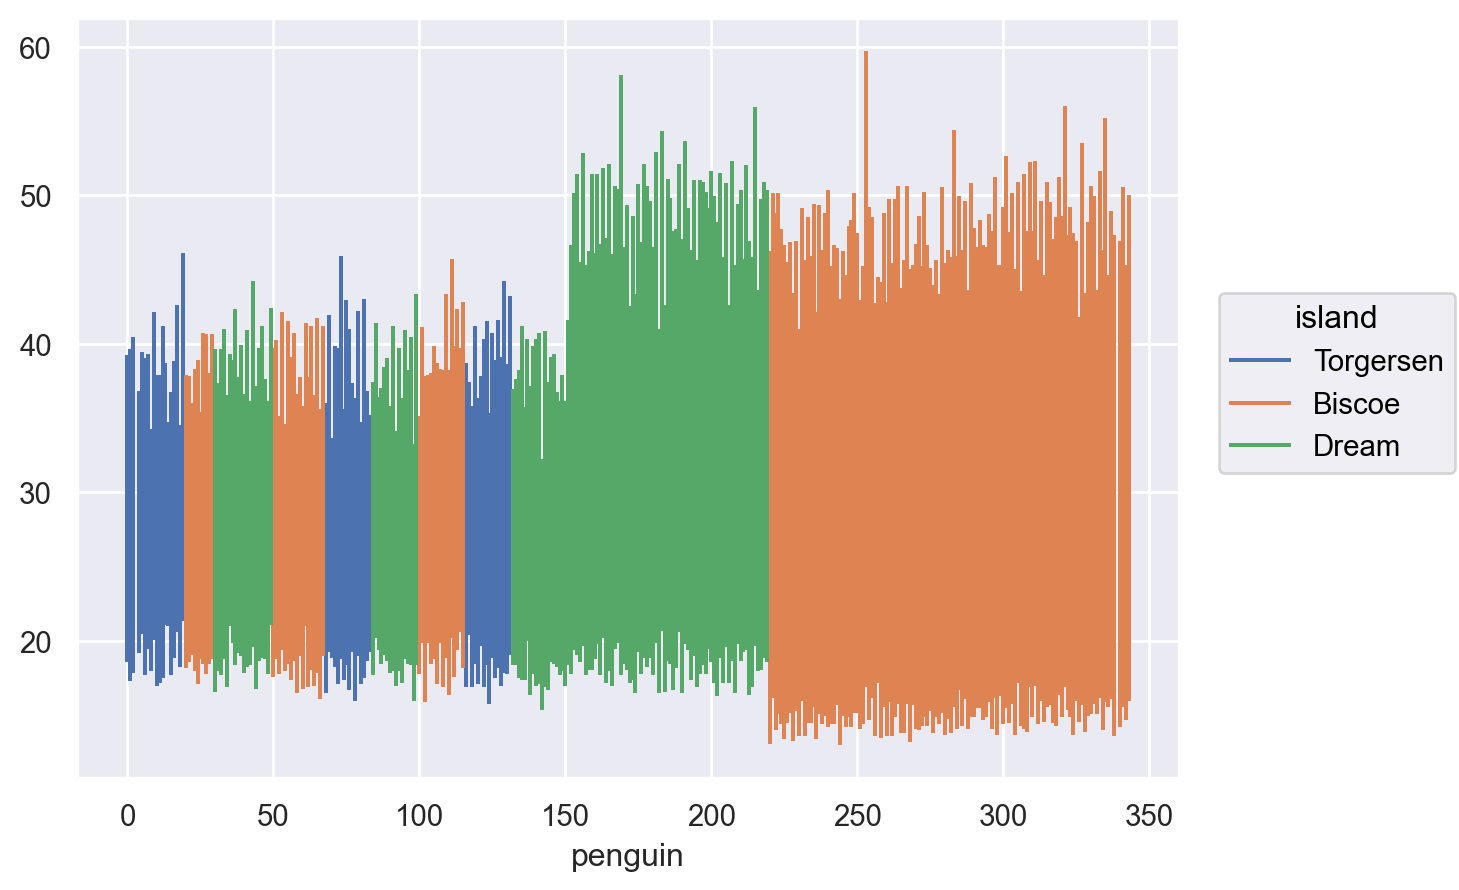
It’s also possible to directly assign the minimum and maximum values for the range:
(
    penguins
    .rename_axis(index="penguin")
    .pipe(so.Plot, x="penguin", ymin="bill_depth_mm", ymax="bill_length_mm")
    .add(so.Range(), color="island")
)
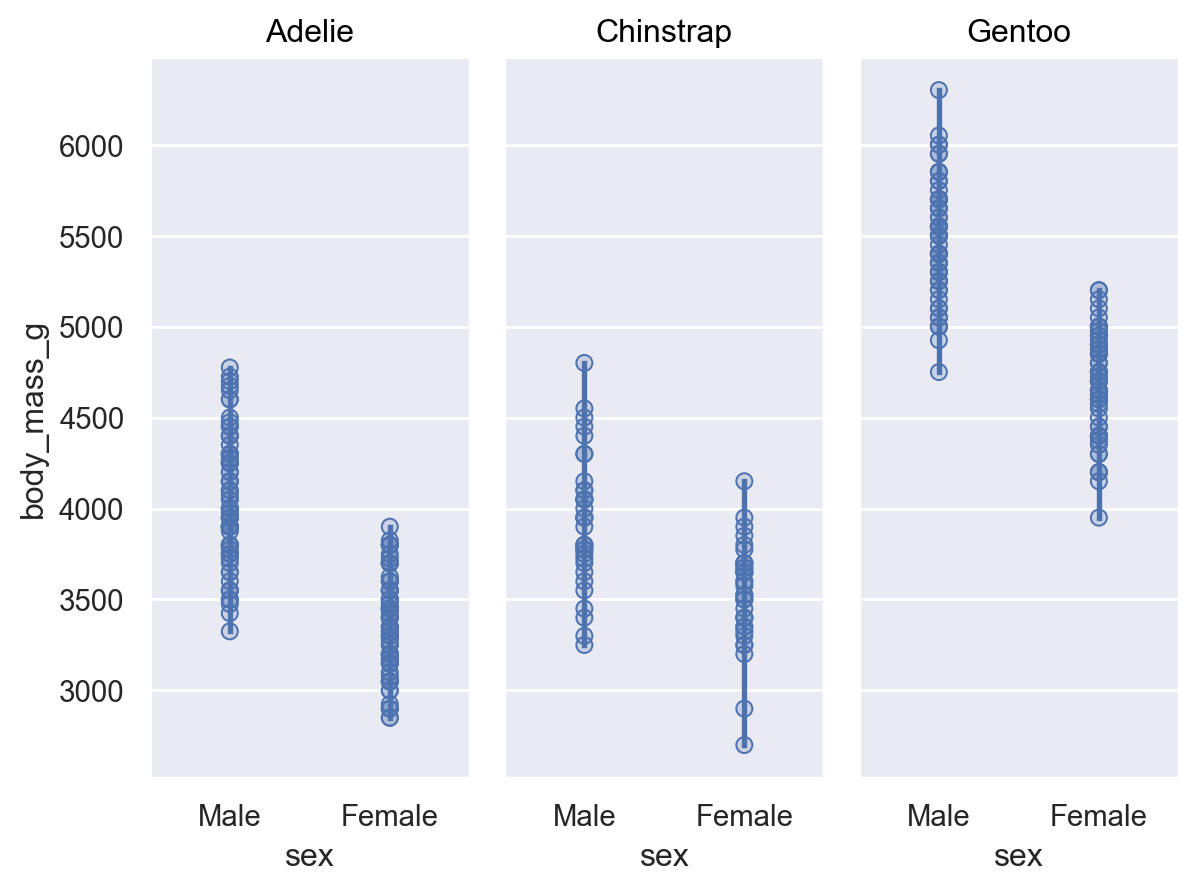
When
min/maxvariables are neither computed as part of a transform or explicitly assigned, the range will cover the full extent of the data at each unique observation on the orient axis:( so.Plot(penguins, x="sex", y="body_mass_g") .facet("species") .add(so.Dots(pointsize=6)) .add(so.Range(linewidth=2)) )