seaborn.objects.Plot.share#
Control sharing of axis limits and ticks across subplots.
Keywords correspond to variables defined in the plot, and values can be boolean (to share across all subplots), or one of “row” or “col” (to share more selectively across one dimension of a grid).
Behavior for non-coordinate variables is currently undefined.
Examples
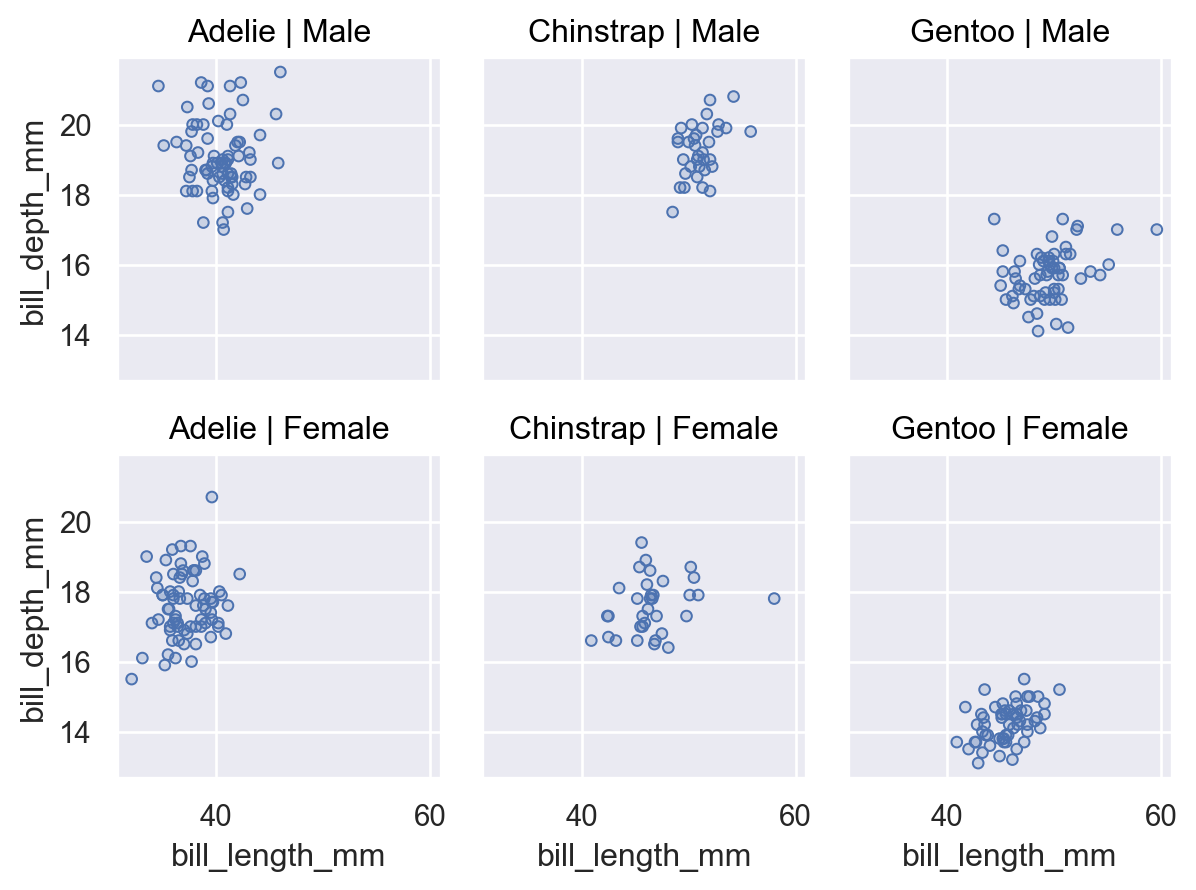
By default, faceted plots will share all axes:
p = (
    so.Plot(penguins, x="bill_length_mm", y="bill_depth_mm")
    .facet(col="species", row="sex")
    .add(so.Dots())
)
p
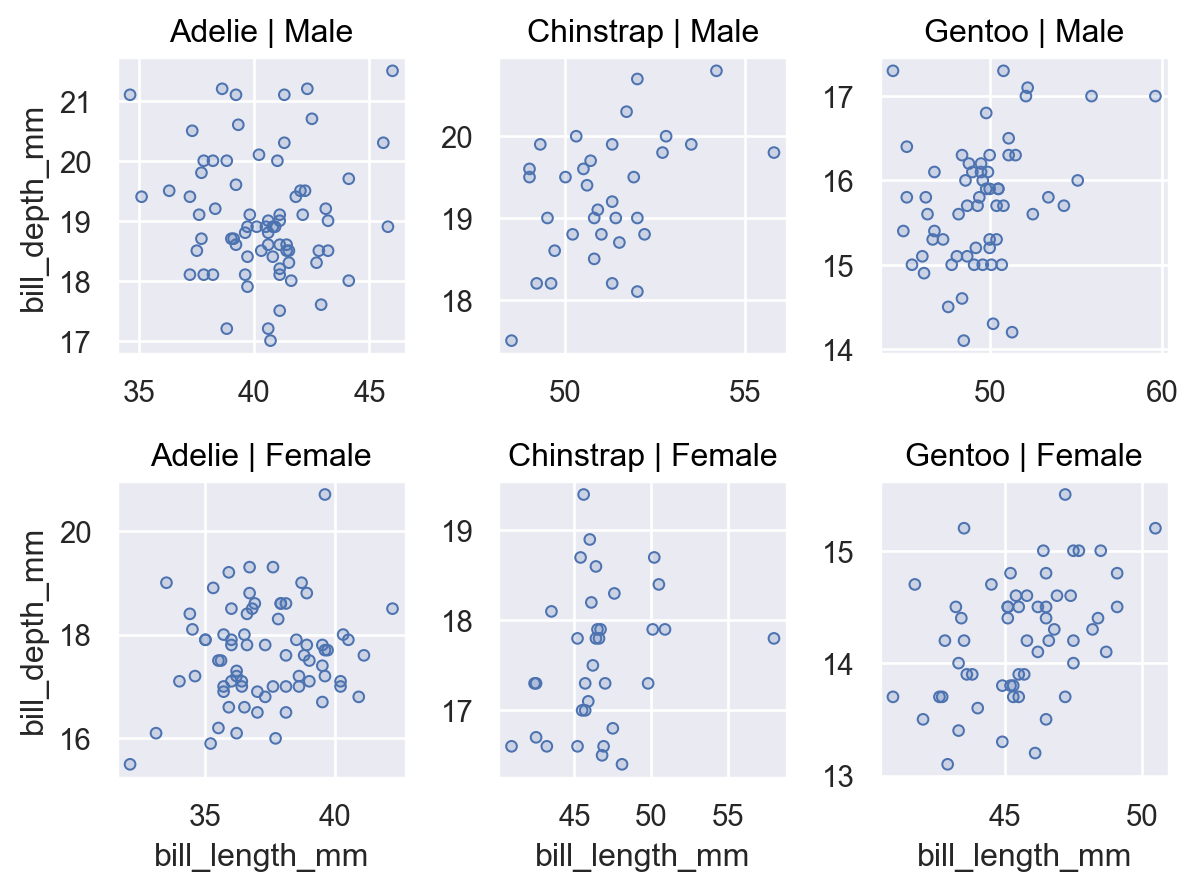
Set a coordinate variable to
Falseto let each subplot adapt independently:p.share(x=False, y=False)
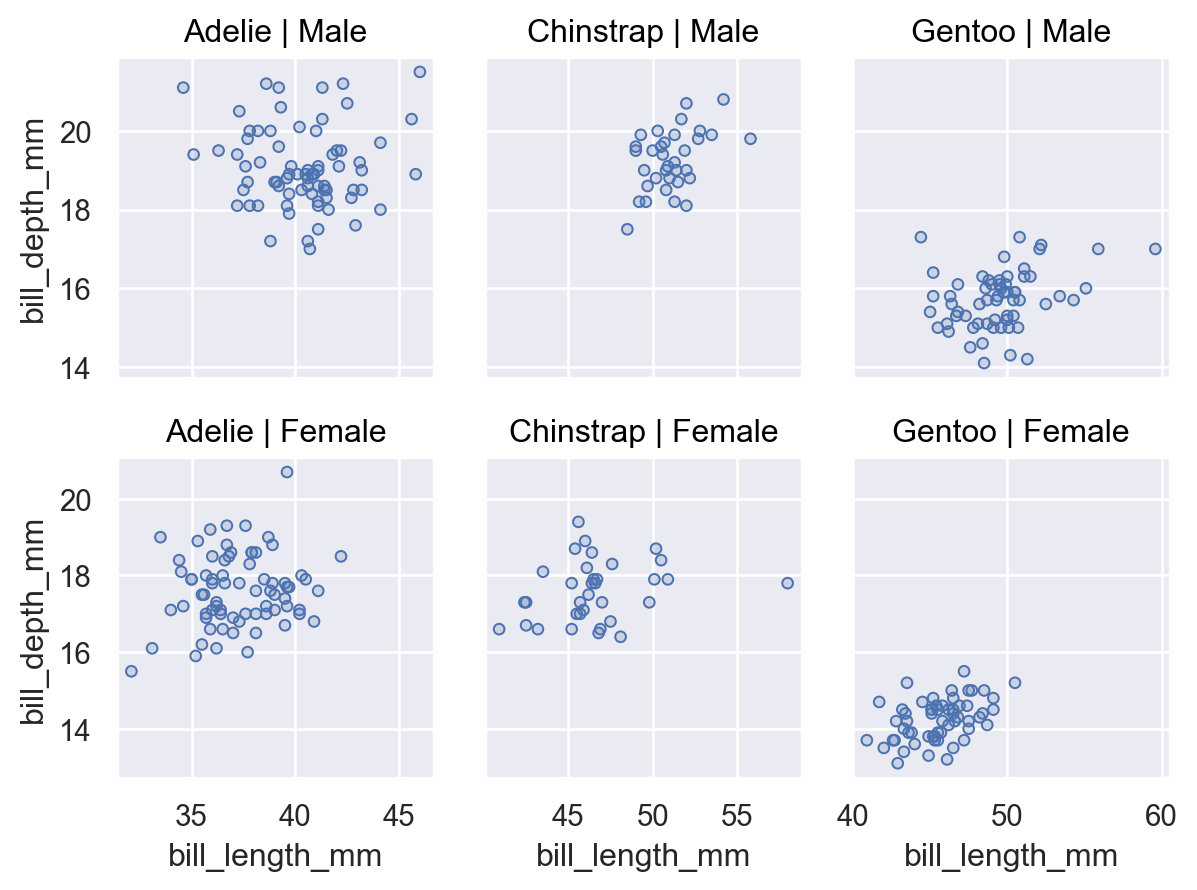
It’s also possible to share only across rows or columns:
p.share(x="col", y="row")
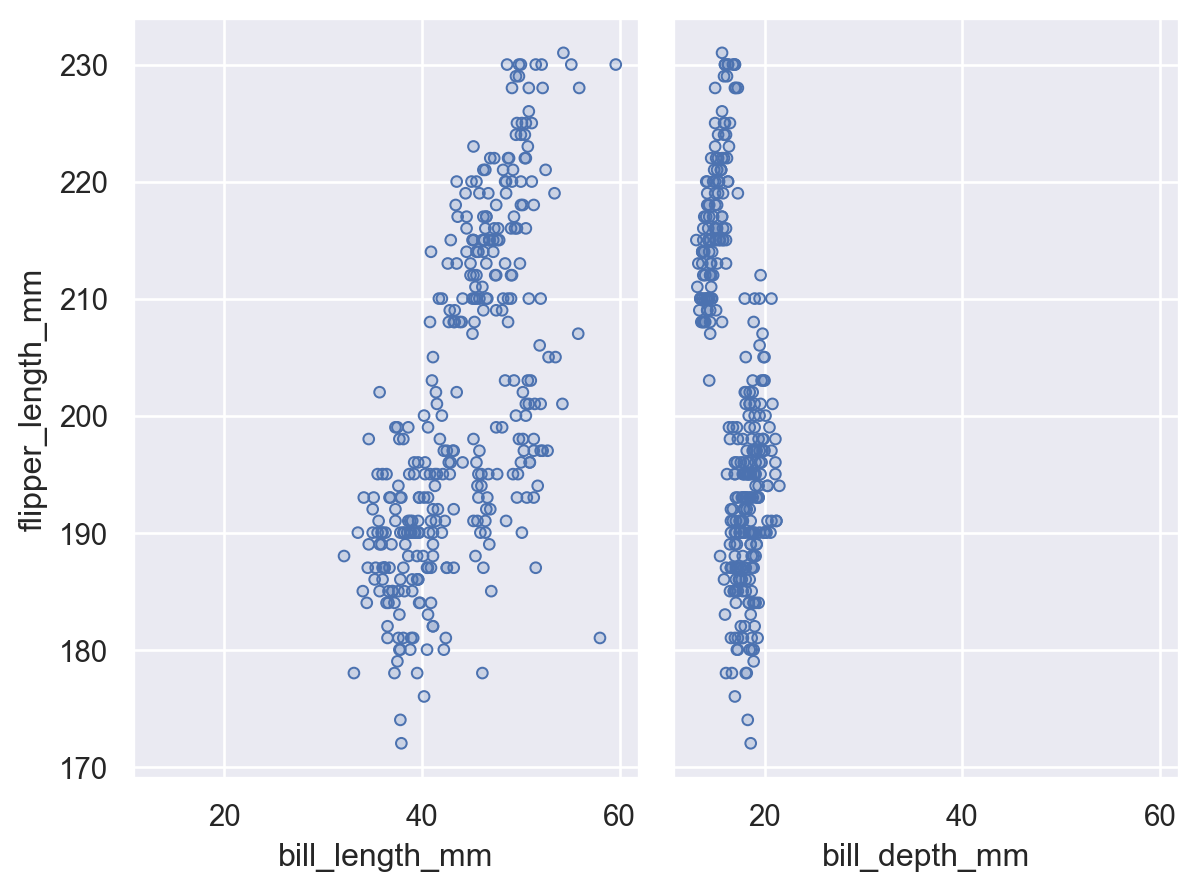
This method is also relevant for paired plots, which have different defaults. In this case, you would need to opt in to full sharing (although it may not always make sense):
(
    so.Plot(penguins, y="flipper_length_mm")
    .pair(x=["bill_length_mm", "bill_depth_mm"])
    .add(so.Dots())
    .share(x=True)
)