seaborn.objects.Band#
- class seaborn.objects.Band(artist_kws=<factory>, color=<'C0'>, alpha=<0.2>, fill=<True>, edgecolor=<depend:color>, edgealpha=<1>, edgewidth=<0>, edgestyle=<'-'>)#
A fill mark representing an interval between values.
- This mark defines the following properties:
color, alpha, fill, edgecolor, edgealpha, edgewidth, edgestyle
See also
AreaA fill mark drawn from a baseline to data values.
Examples
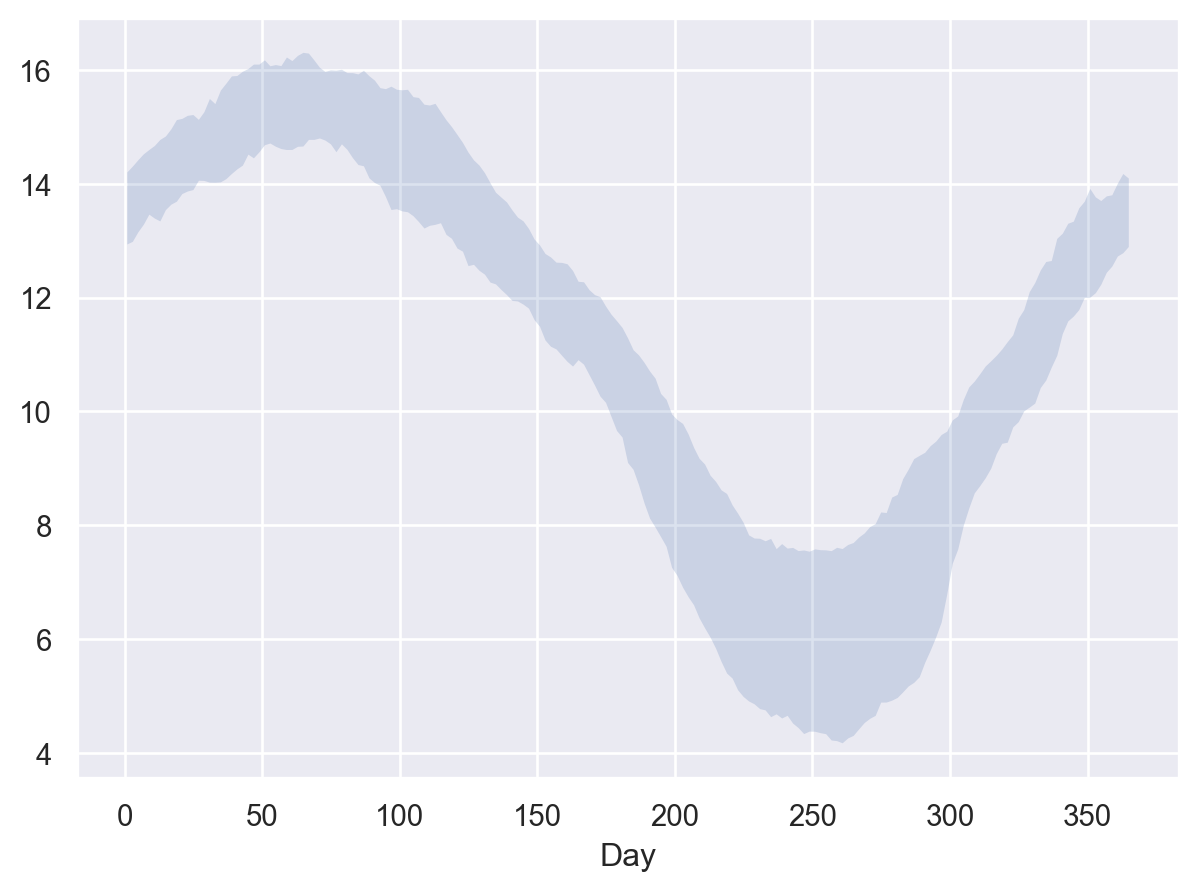
The mark fills between pairs of data points to show an interval on the value axis:
p = so.Plot(seaice, x="Day", ymin="1980", ymax="2019")
p.add(so.Band())
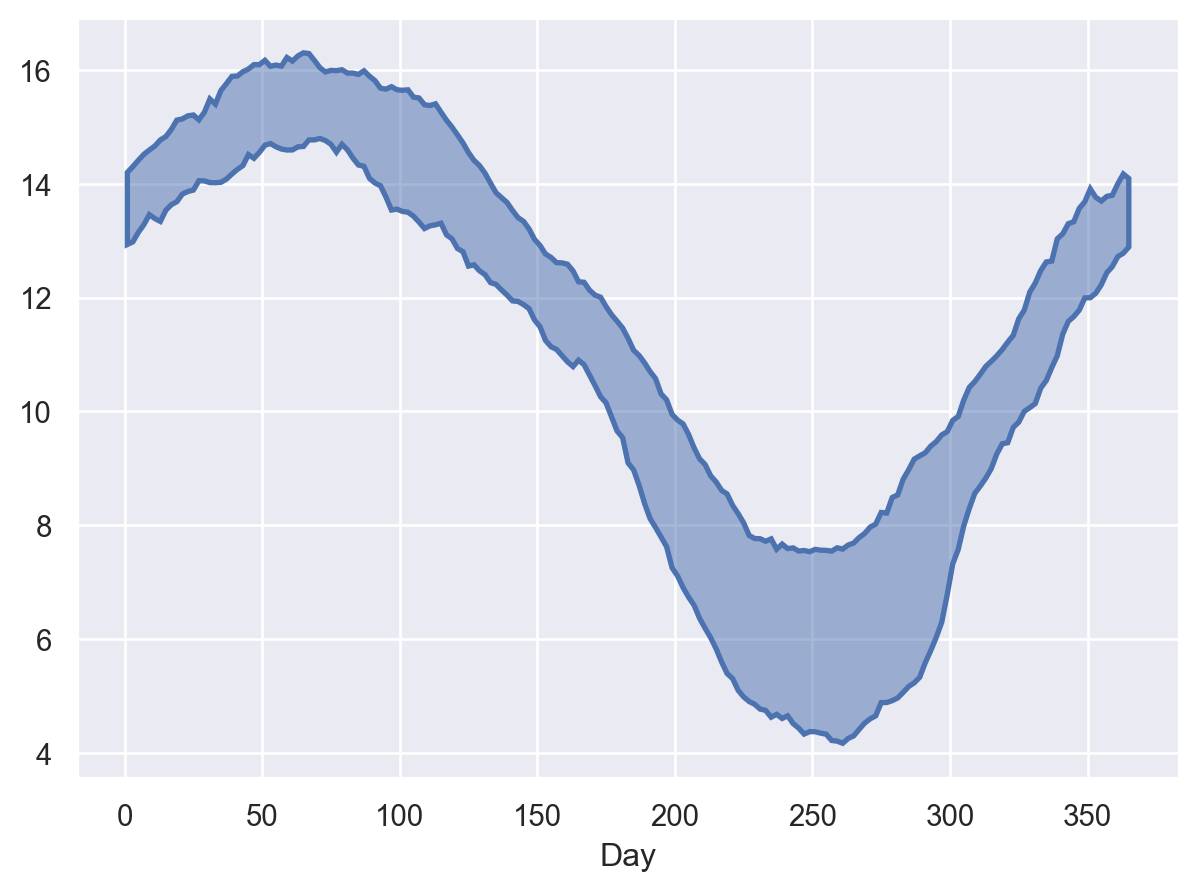
By default it draws a faint ribbon with no edges, but edges can be added:
p.add(so.Band(alpha=.5, edgewidth=2))
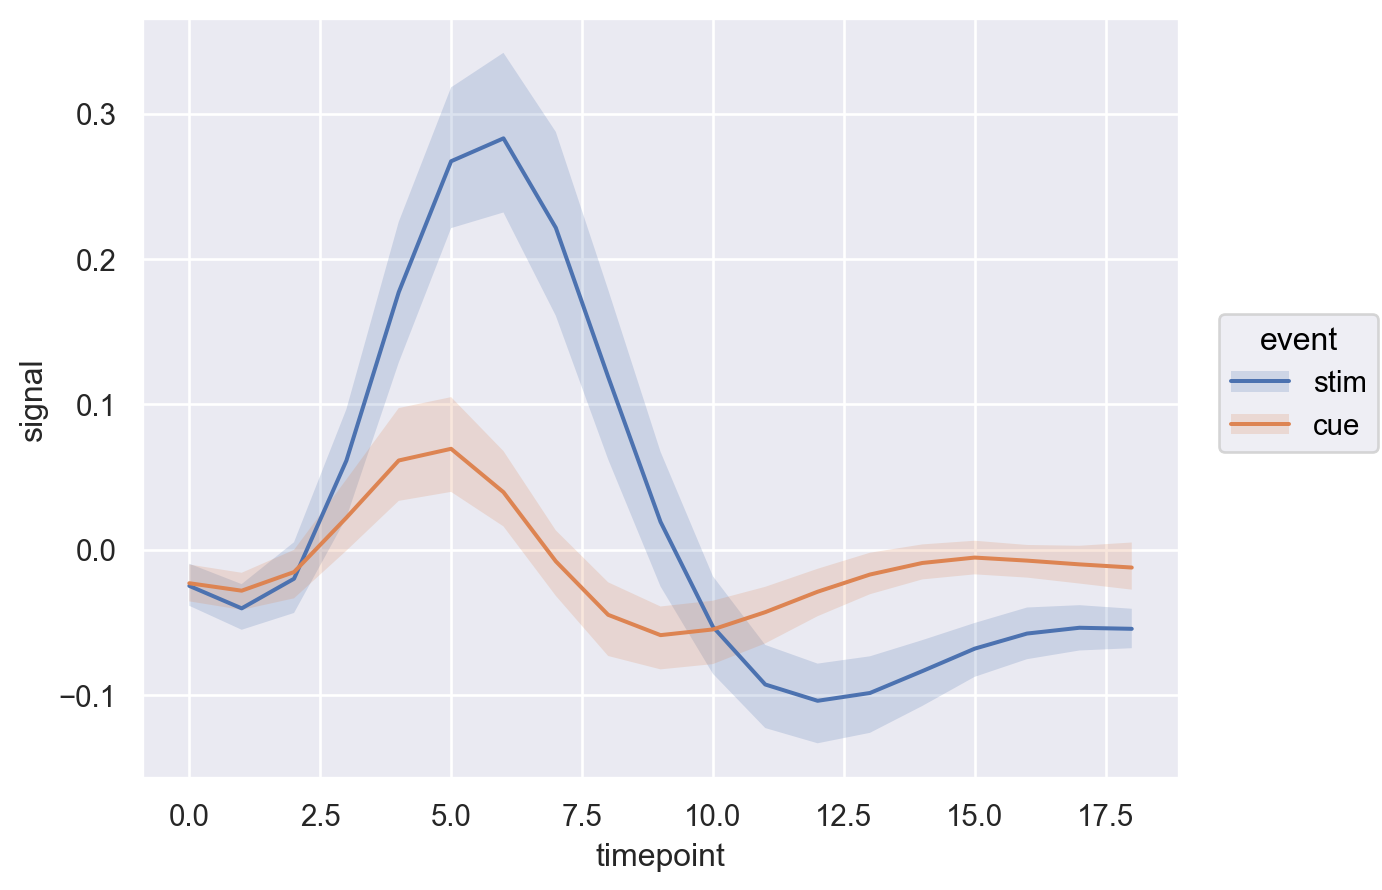
The defaults are optimized for the main expected usecase, where the mark is combined with a line to show an errorbar interval:
(
    so.Plot(fmri, x="timepoint", y="signal", color="event")
    .add(so.Band(), so.Est())
    .add(so.Line(), so.Agg())
)
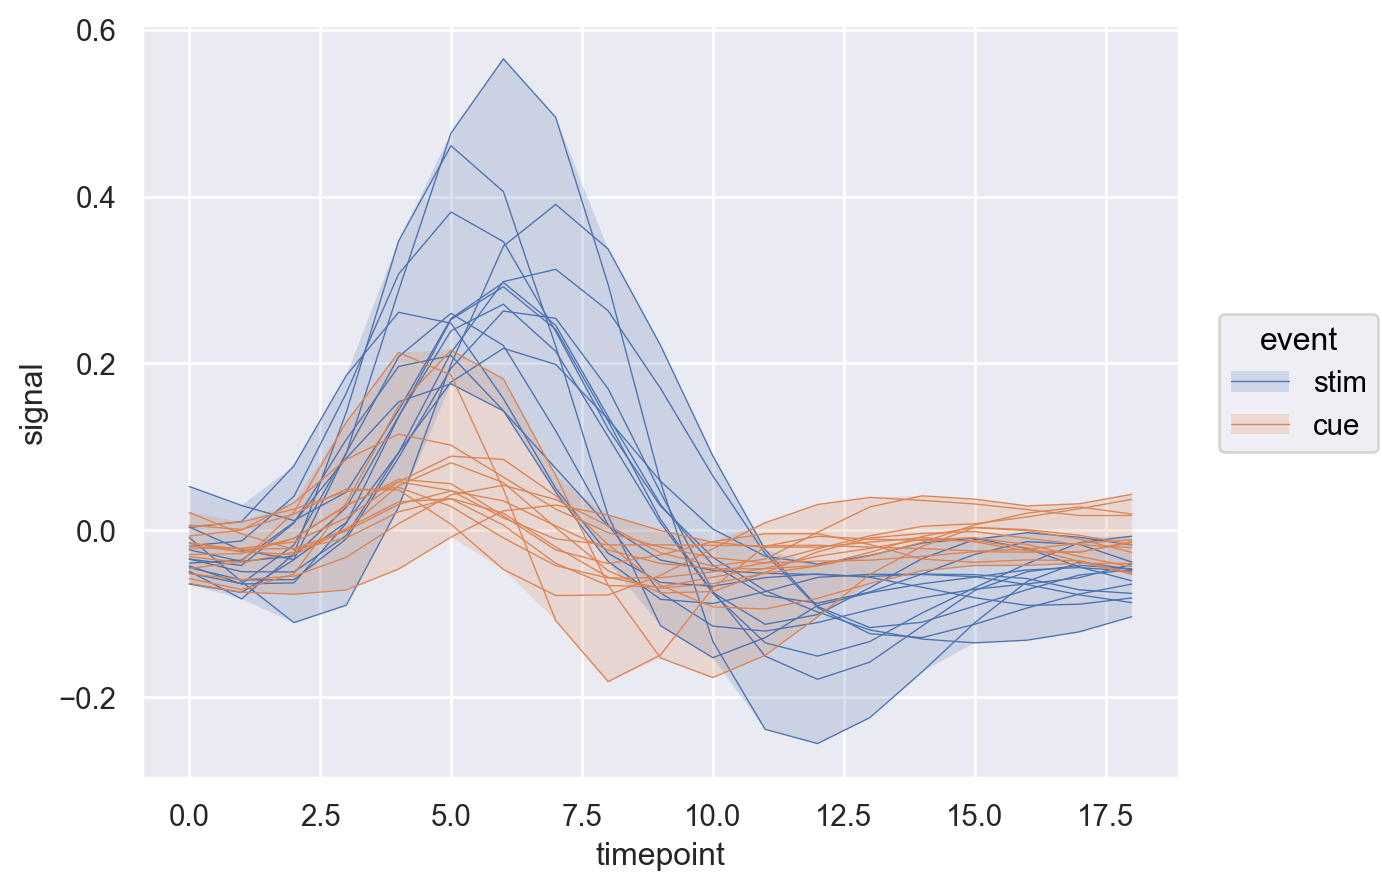
When min/max values are not explicitly assigned or added in a transform, the band will cover the full extent of the data:
(
    so.Plot(fmri, x="timepoint", y="signal", color="event")
    .add(so.Line(linewidth=.5), group="subject")
    .add(so.Band())
)