seaborn.objects.Text#
- class seaborn.objects.Text(artist_kws=<factory>, text=<''>, color=<'k'>, alpha=<1>, fontsize=<rc:font.size>, halign=<'center'>, valign=<'center_baseline'>, offset=<4>)#
A textual mark to annotate or represent data values.
Examples
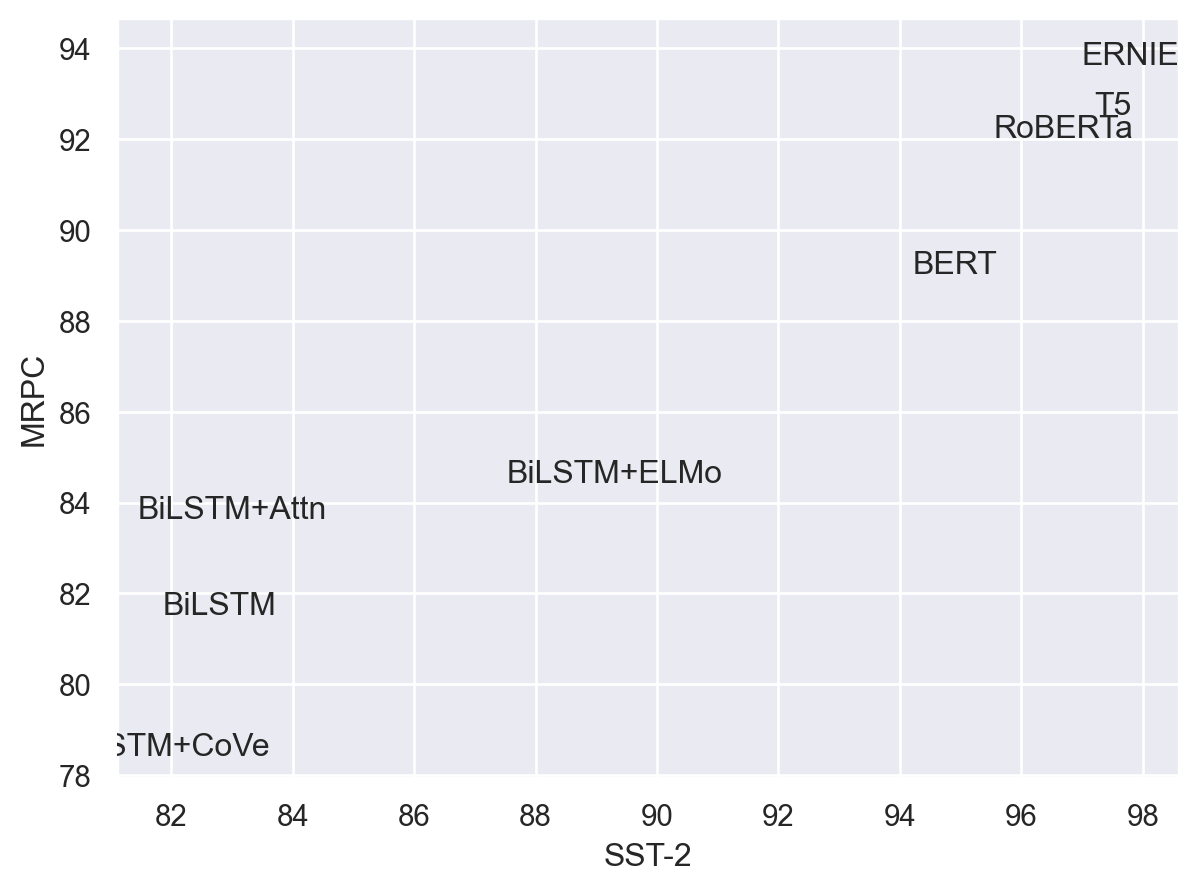
Add text at x/y locations on the plot:
(
    so.Plot(glue, x="SST-2", y="MRPC", text="Model")
    .add(so.Text())
)
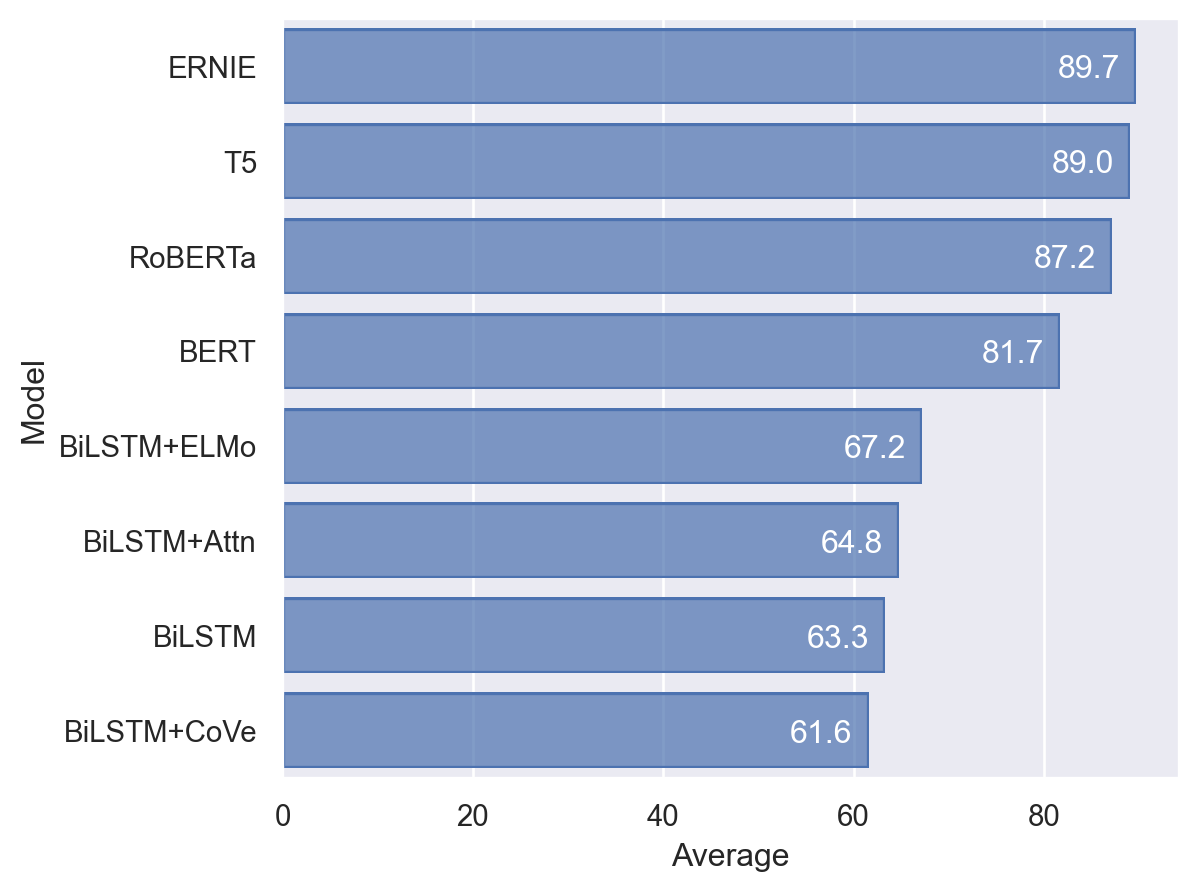
Add bar annotations, horizontally-aligned with
halign:( so.Plot(glue, x="Average", y="Model", text="Average") .add(so.Bar()) .add(so.Text(color="w", halign="right")) )

Fine-tune the alignment using
offset:( so.Plot(glue, x="Average", y="Model", text="Average") .add(so.Bar()) .add(so.Text(color="w", halign="right", offset=6)) )
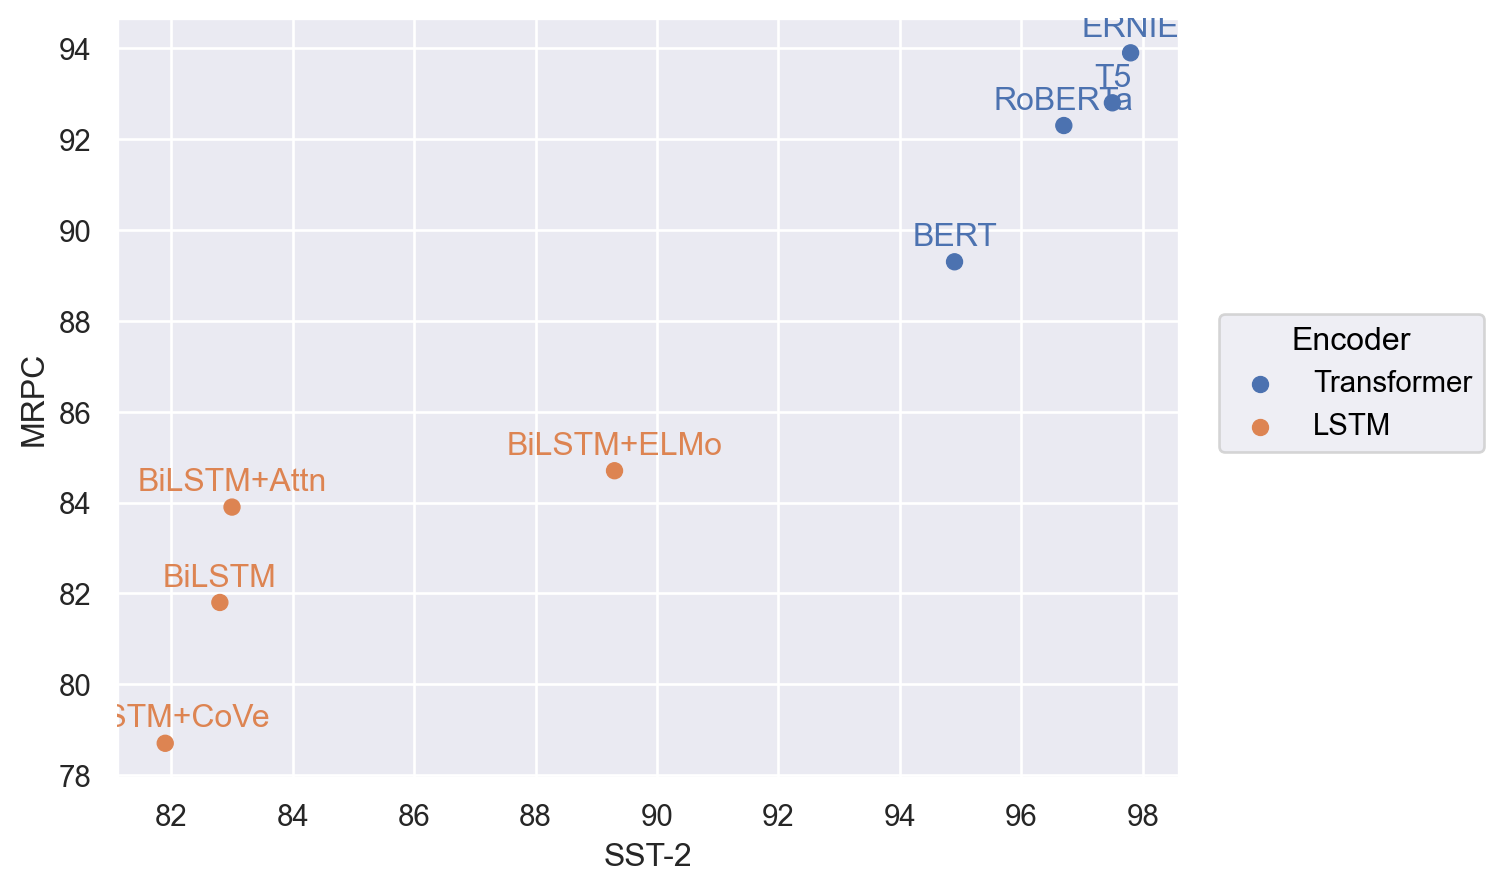
Add text above dots, mapping the text color with a third variable:
(
    so.Plot(glue, x="SST-2", y="MRPC", color="Encoder", text="Model")
    .add(so.Dot())
    .add(so.Text(valign="bottom"))

)
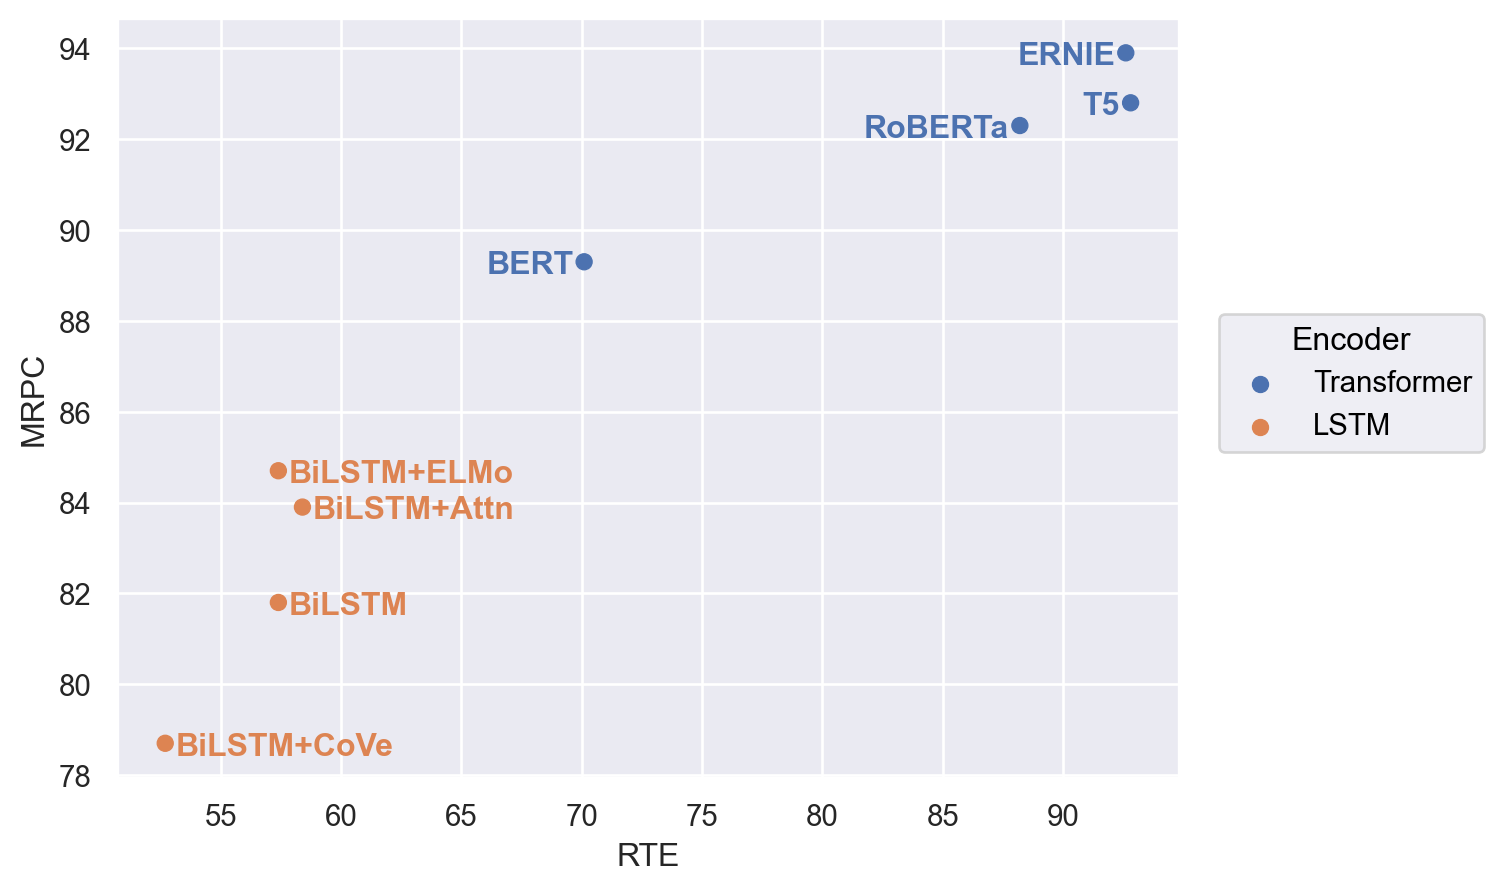
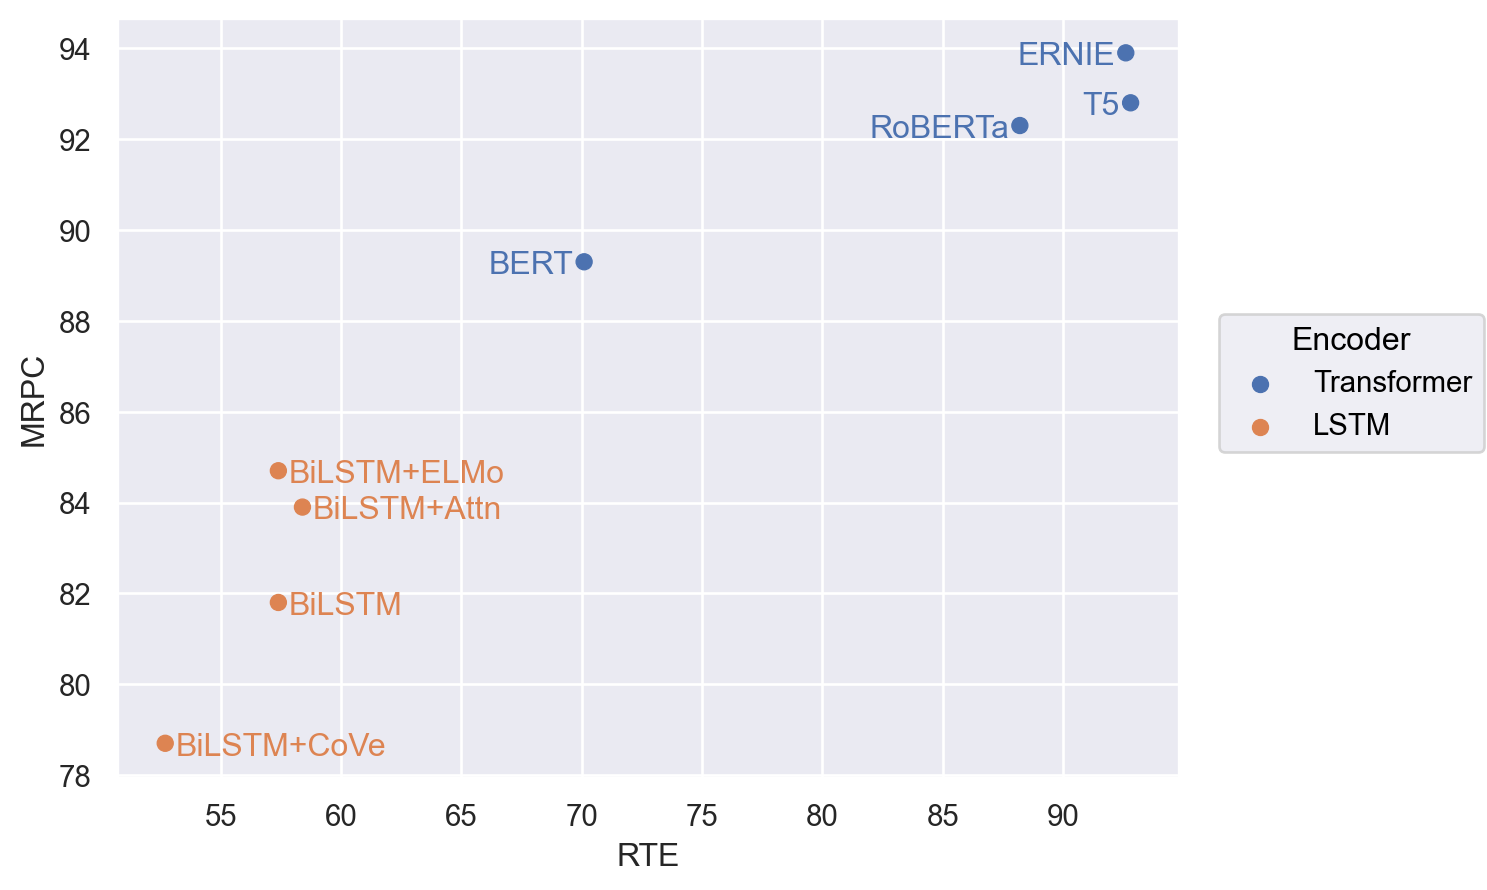
Map the text alignment for better use of space:
(
    so.Plot(glue, x="RTE", y="MRPC", color="Encoder", text="Model")
    .add(so.Dot())
    .add(so.Text(), halign="Encoder")
    .scale(halign={"LSTM": "left", "Transformer": "right"})
)
Use additional matplotlib parameters to control the appearance of the text:
(
    so.Plot(glue, x="RTE", y="MRPC", color="Encoder", text="Model")
    .add(so.Dot())
    .add(so.Text({"fontweight": "bold"}), halign="Encoder")
    .scale(halign={"LSTM": "left", "Transformer": "right"})
)