seaborn.objects.Plot.facet#
- Plot.facet(col=None, row=None, order=None, wrap=None)#
Produce subplots with conditional subsets of the data.
- Parameters:
- col, rowdata vectors or identifiers
Variables used to define subsets along the columns and/or rows of the grid. Can be references to the global data source passed in the constructor.
- orderlist of strings, or dict with dimensional keys
Define the order of the faceting variables.
- wrapint
When using only
colorrow, wrap subplots across a two-dimensional grid with this many subplots on the faceting dimension.
Examples
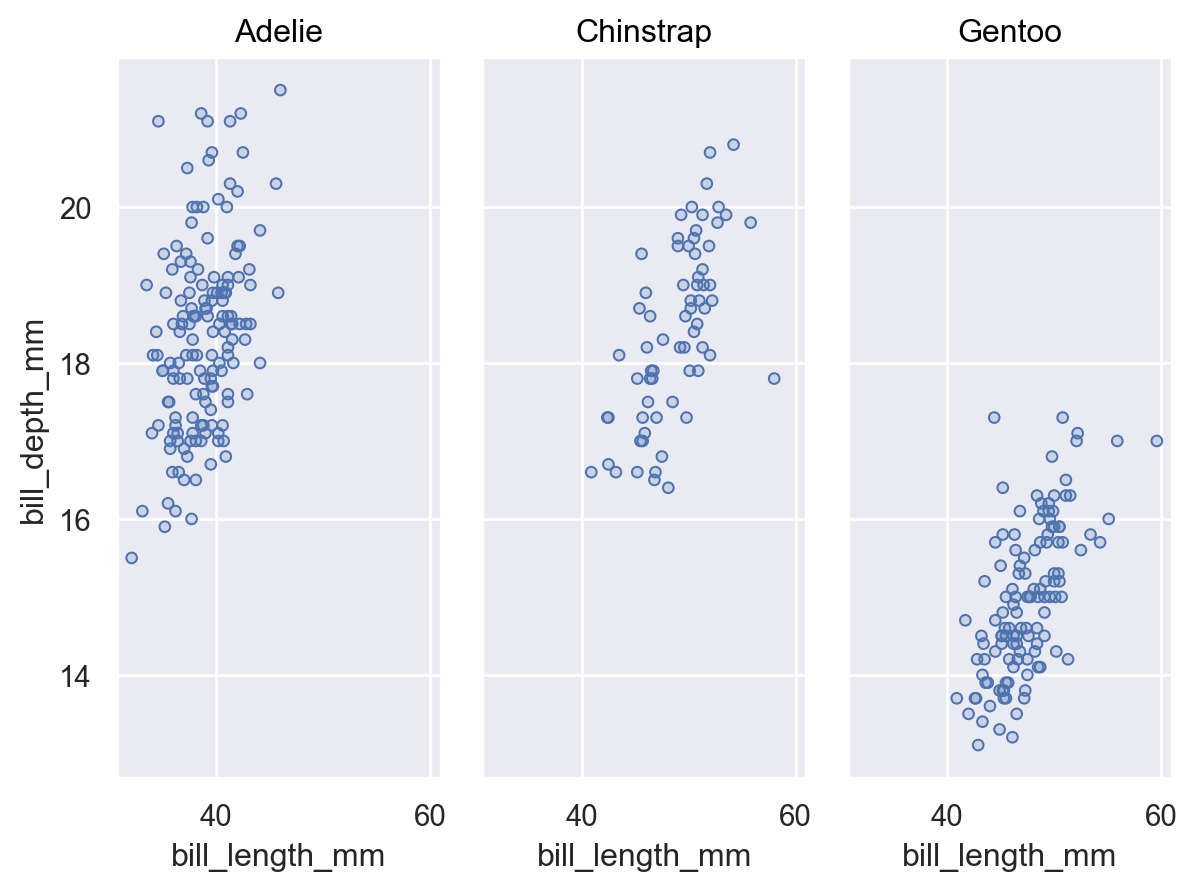
Assigning a faceting variable will create multiple subplots and plot subsets of the data on each of them:
p = so.Plot(penguins, "bill_length_mm", "bill_depth_mm").add(so.Dots())
p.facet("species")
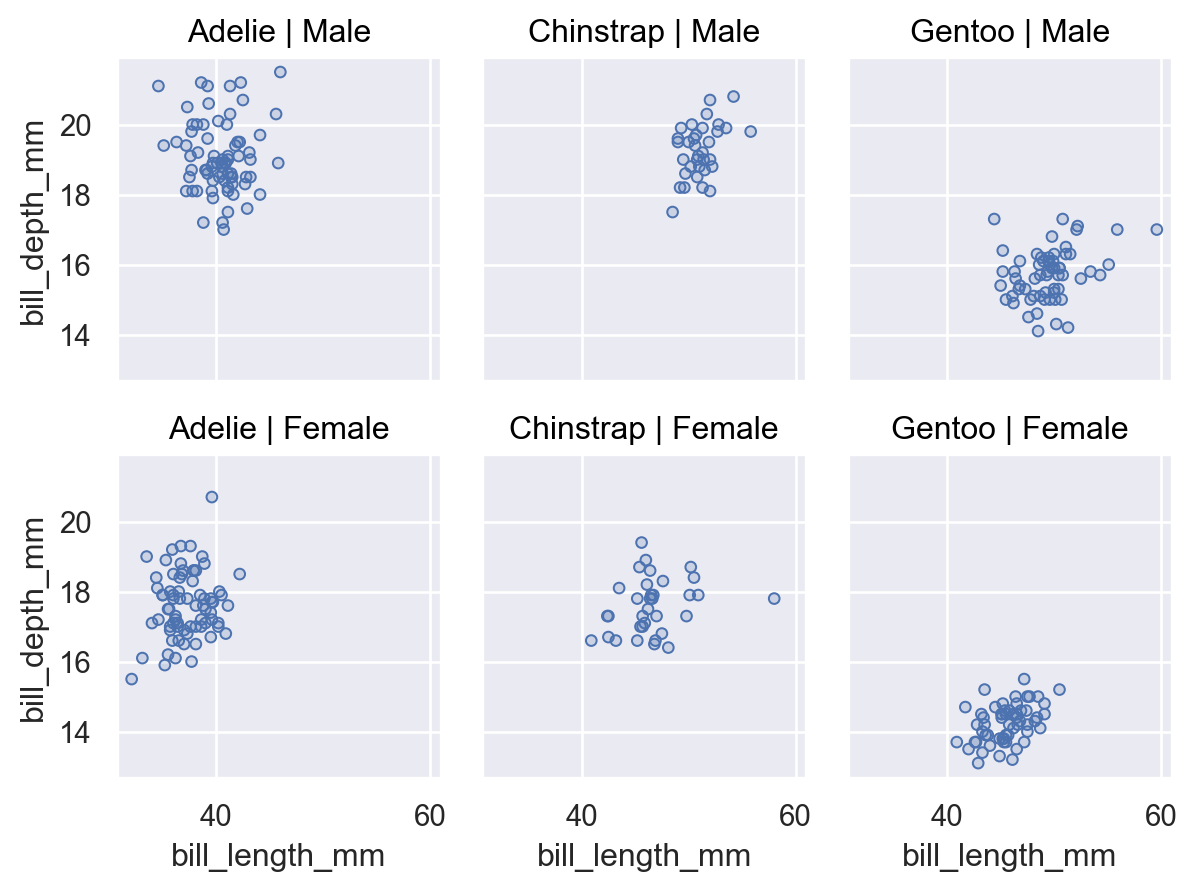
Multiple faceting variables can be defined to create a two-dimensional grid:
p.facet("species", "sex")
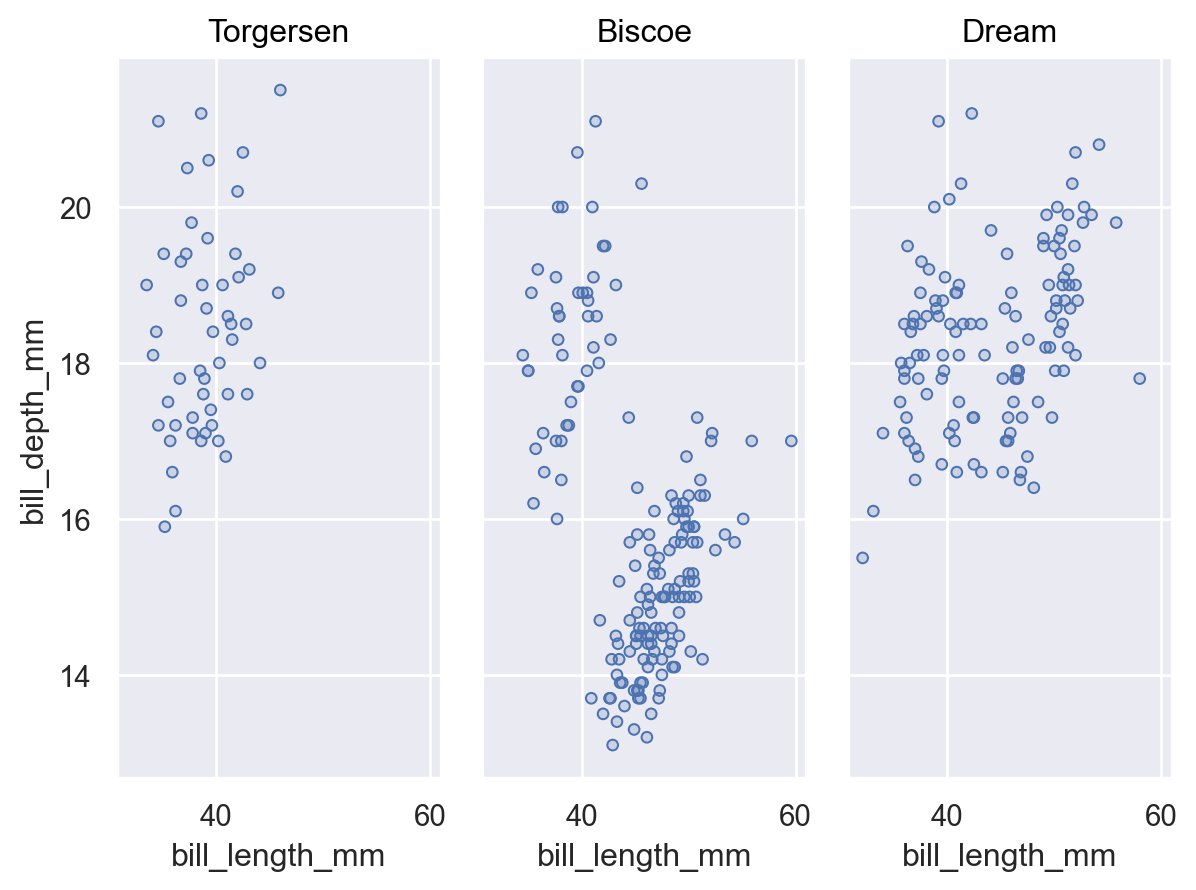
Facet variables can be provided as references to the global plot data or as vectors:
p.facet(penguins["island"])
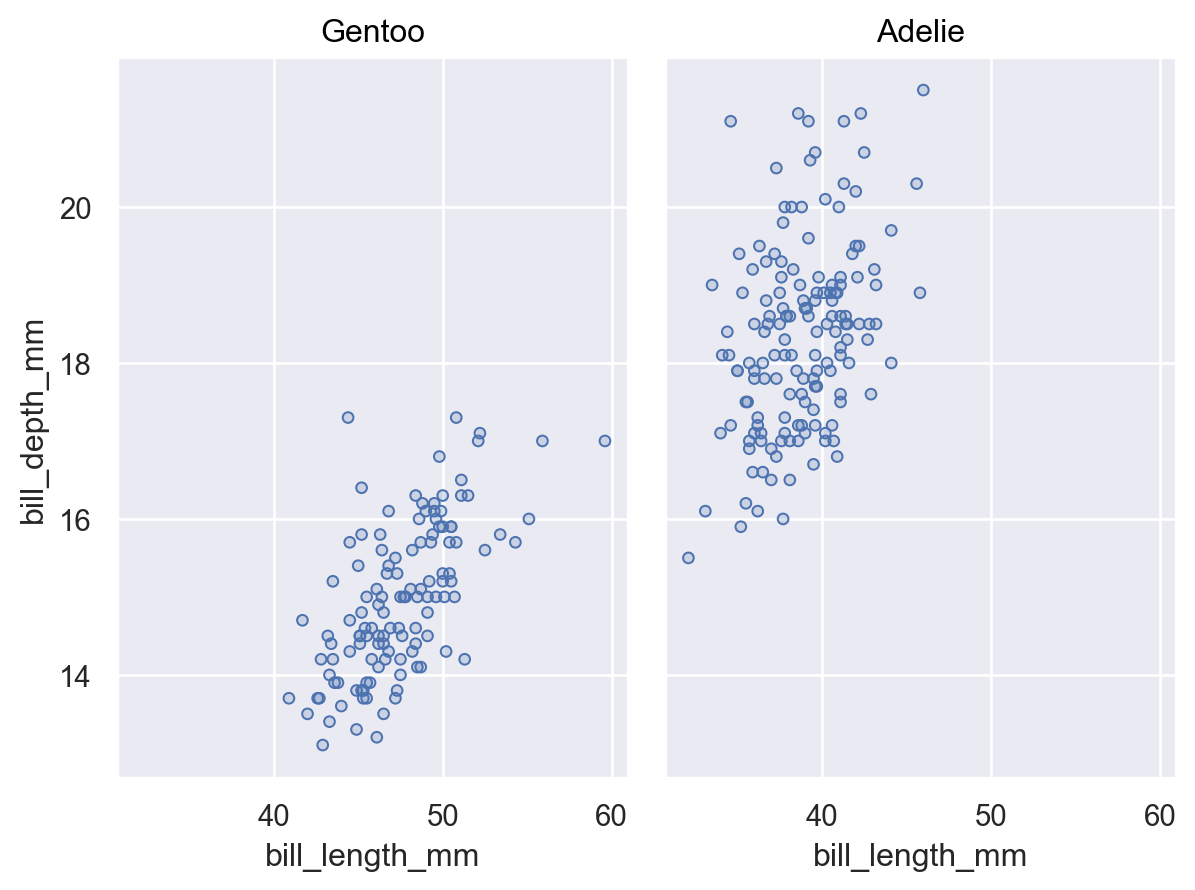
With a single faceting variable, arrange the facets or limit to a subset by passing a list of levels to
order:p.facet("species", order=["Gentoo", "Adelie"])
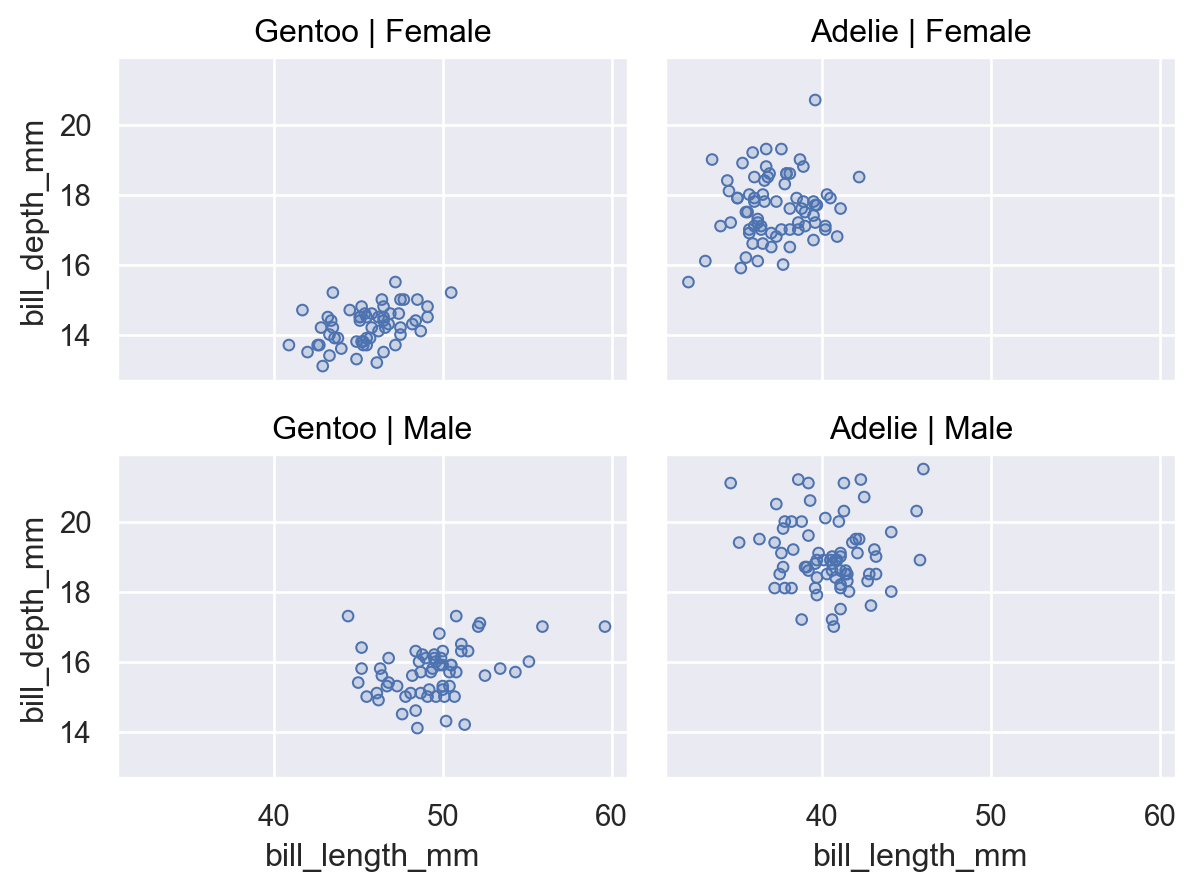
With multiple variables, pass
orderas a dictionary:p.facet("species", "sex", order={"col": ["Gentoo", "Adelie"], "row": ["Female", "Male"]})
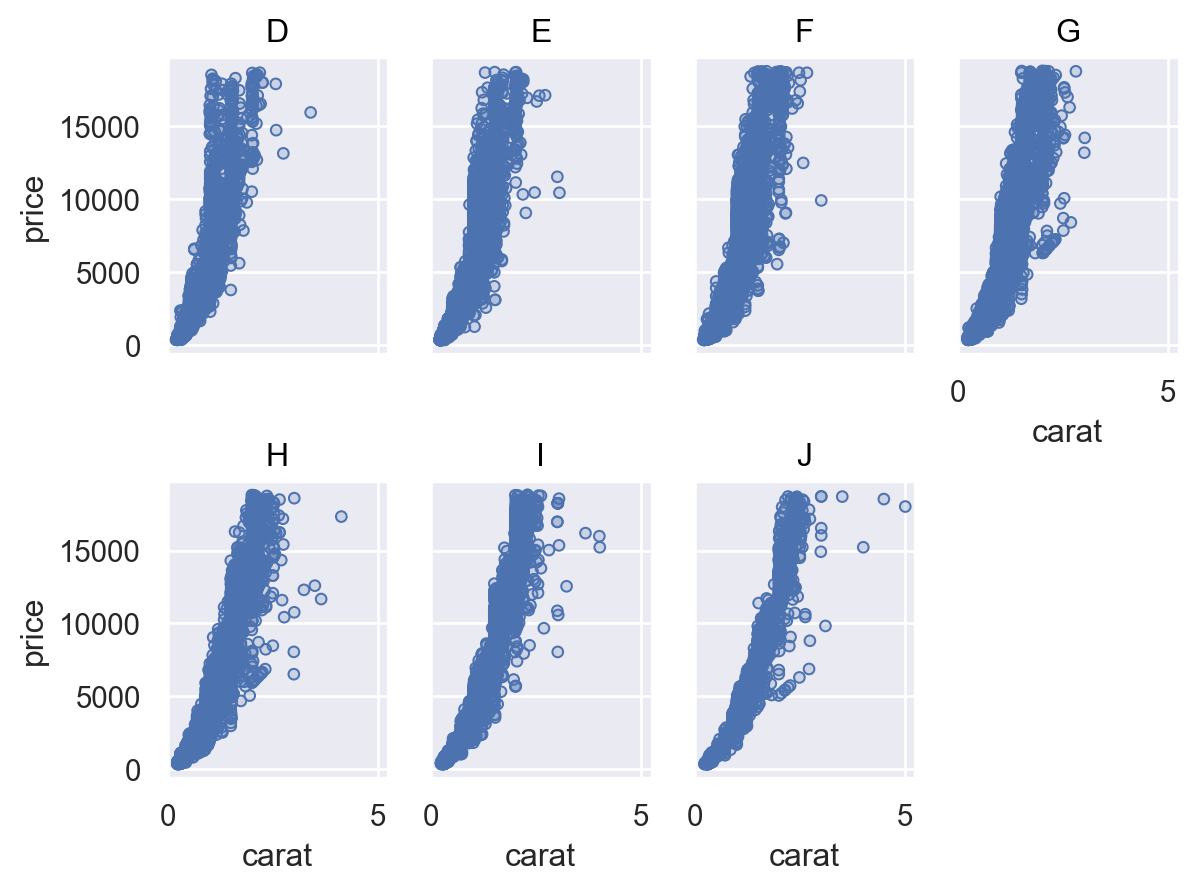
When the faceting variable has multiple levels, you can
wrapit to distribute subplots across both dimensions:p = so.Plot(diamonds, x="carat", y="price").add(so.Dots()) p.facet("color", wrap=4)
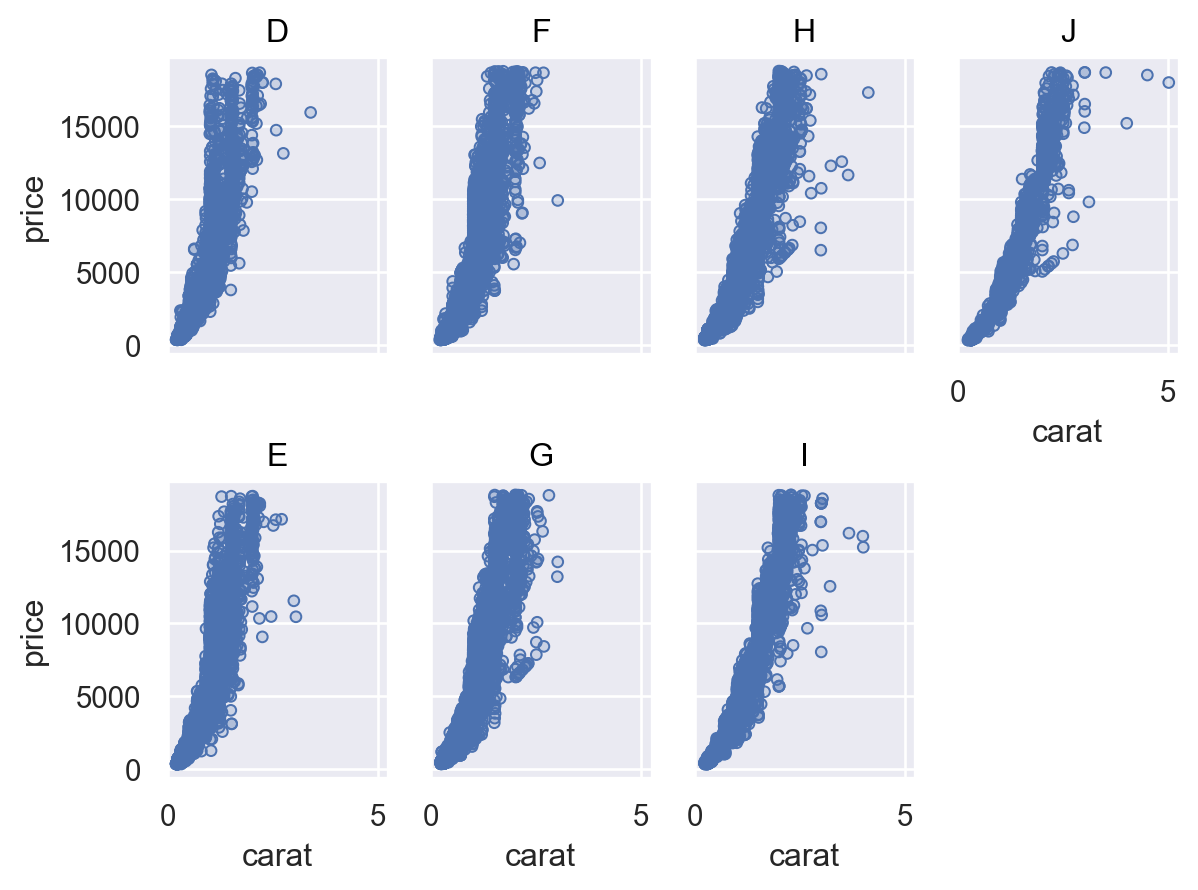
Wrapping works only when there is a single variable, but you can wrap in either direction:
p.facet(row="color", wrap=2)
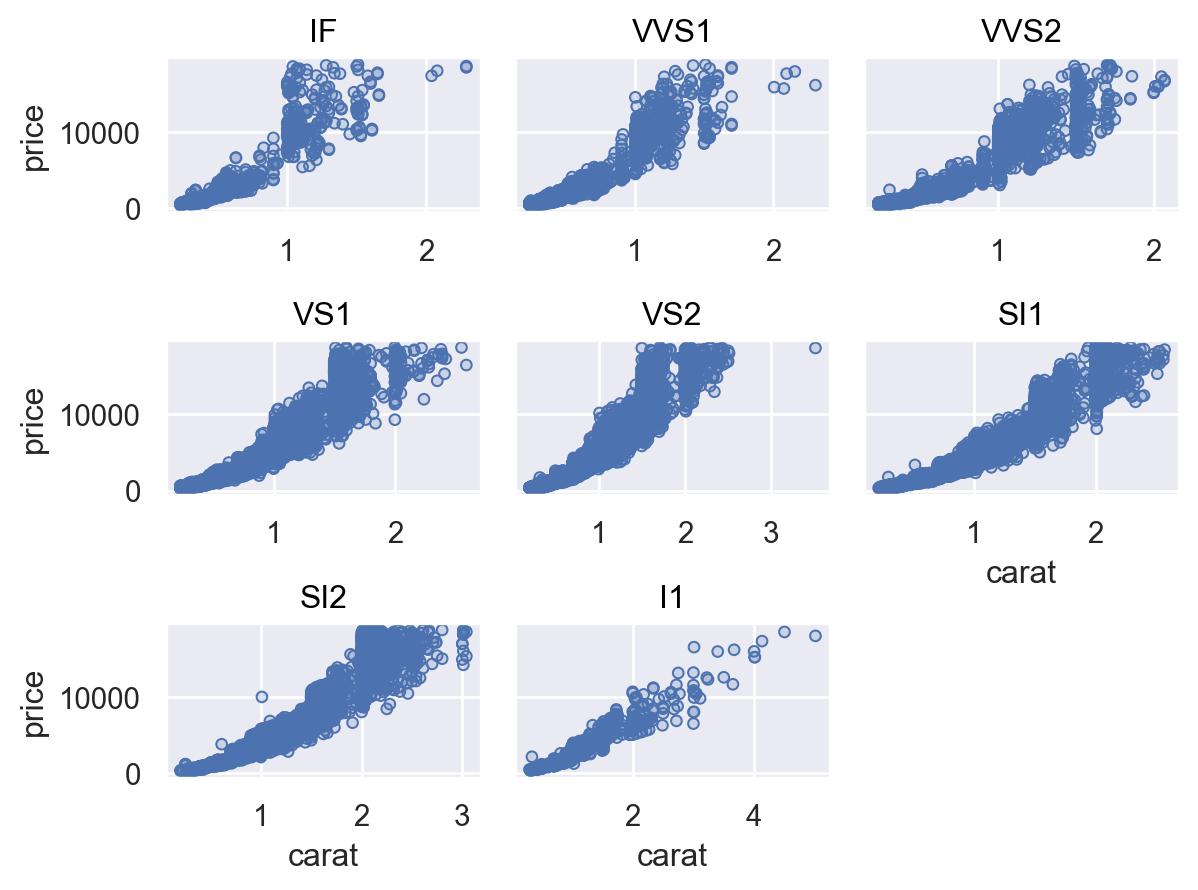
Use
Plot.share()to specify whether facets should be scaled the same way:p.facet("clarity", wrap=3).share(x=False)
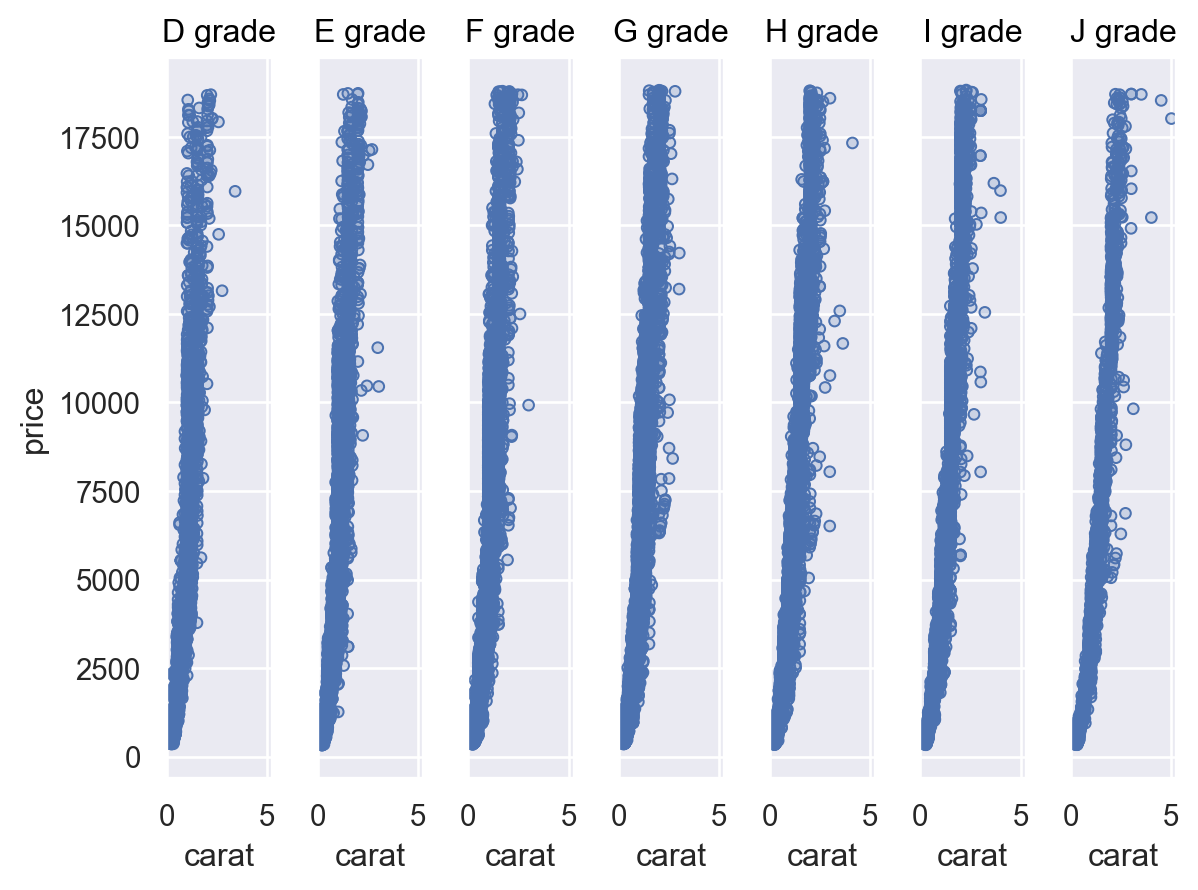
Use
Plot.label()to tweak the titles:p.facet("color").label(title="{} grade".format)