seaborn.objects.Perc#
- class seaborn.objects.Perc(k=5, method='linear')#
Replace observations with percentile values.
- Parameters:
- klist of numbers or int
If a list of numbers, this gives the percentiles (in [0, 100]) to compute. If an integer, compute
kevenly-spaced percentiles between 0 and 100. For example,k=5computes the 0, 25, 50, 75, and 100th percentiles.- methodstr
Method for interpolating percentiles between observed datapoints. See
numpy.percentile()for valid options and more information.
Examples
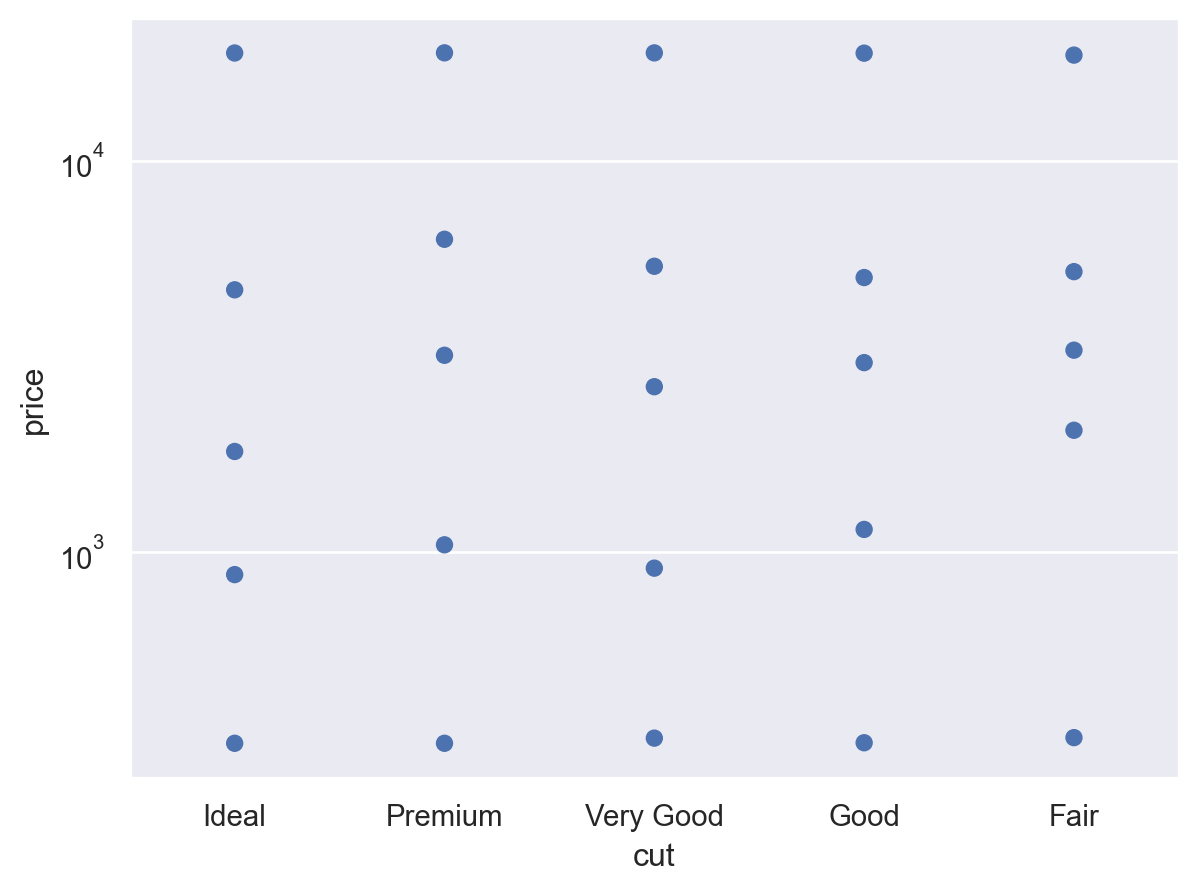
The default behavior computes the quartiles and min/max of the input data:
p = (
    so.Plot(diamonds, "cut", "price")
    .scale(y="log")
)
p.add(so.Dot(), so.Perc())
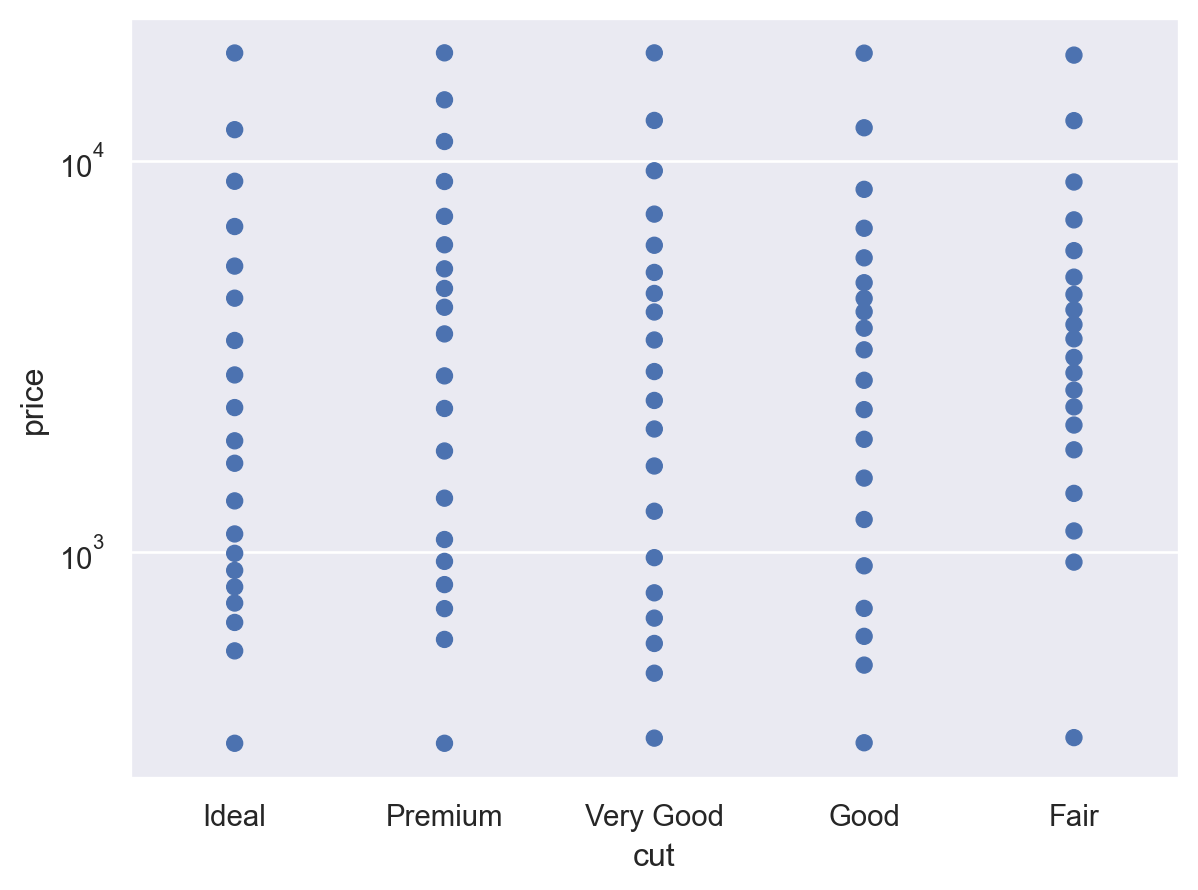
Passing an integer will compute that many evenly-spaced percentiles:
p.add(so.Dot(), so.Perc(20))
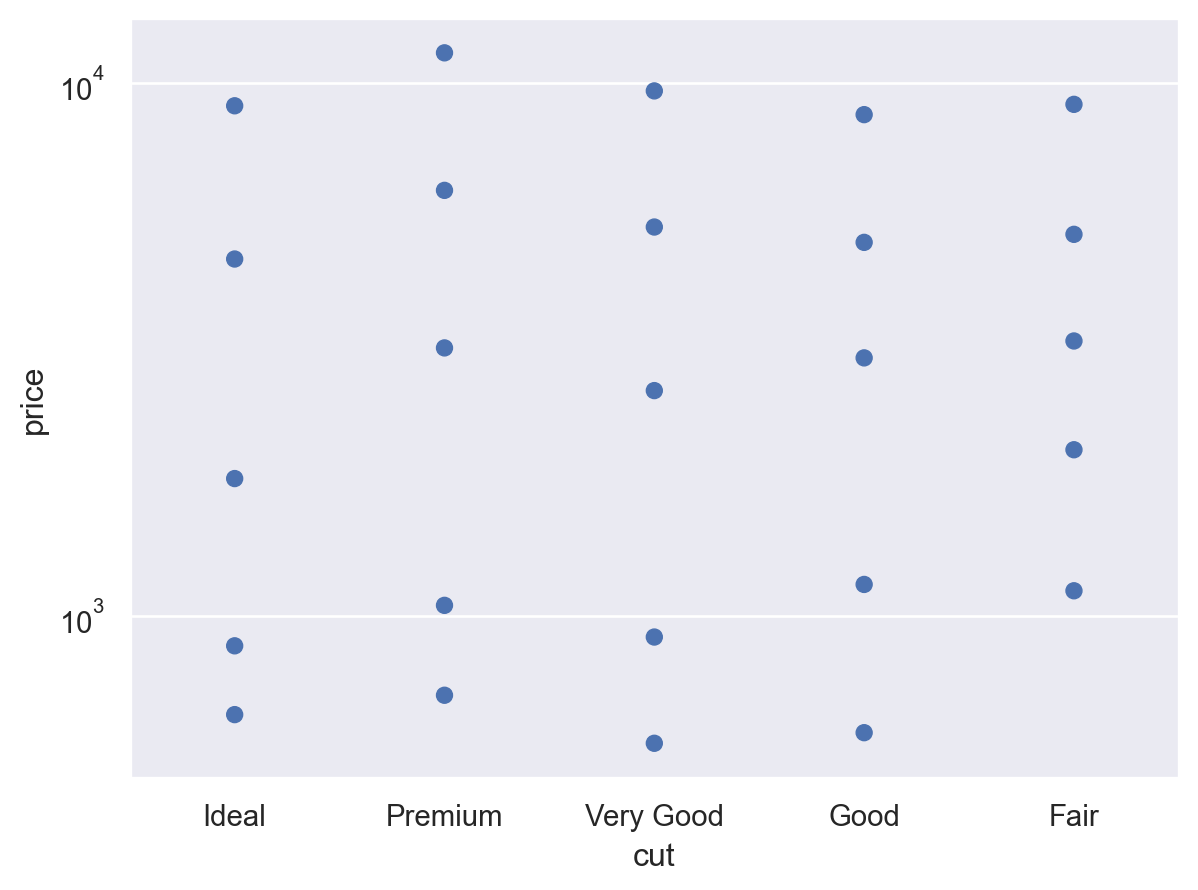
Passing a list will compute exactly those percentiles:
p.add(so.Dot(), so.Perc([10, 25, 50, 75, 90]))
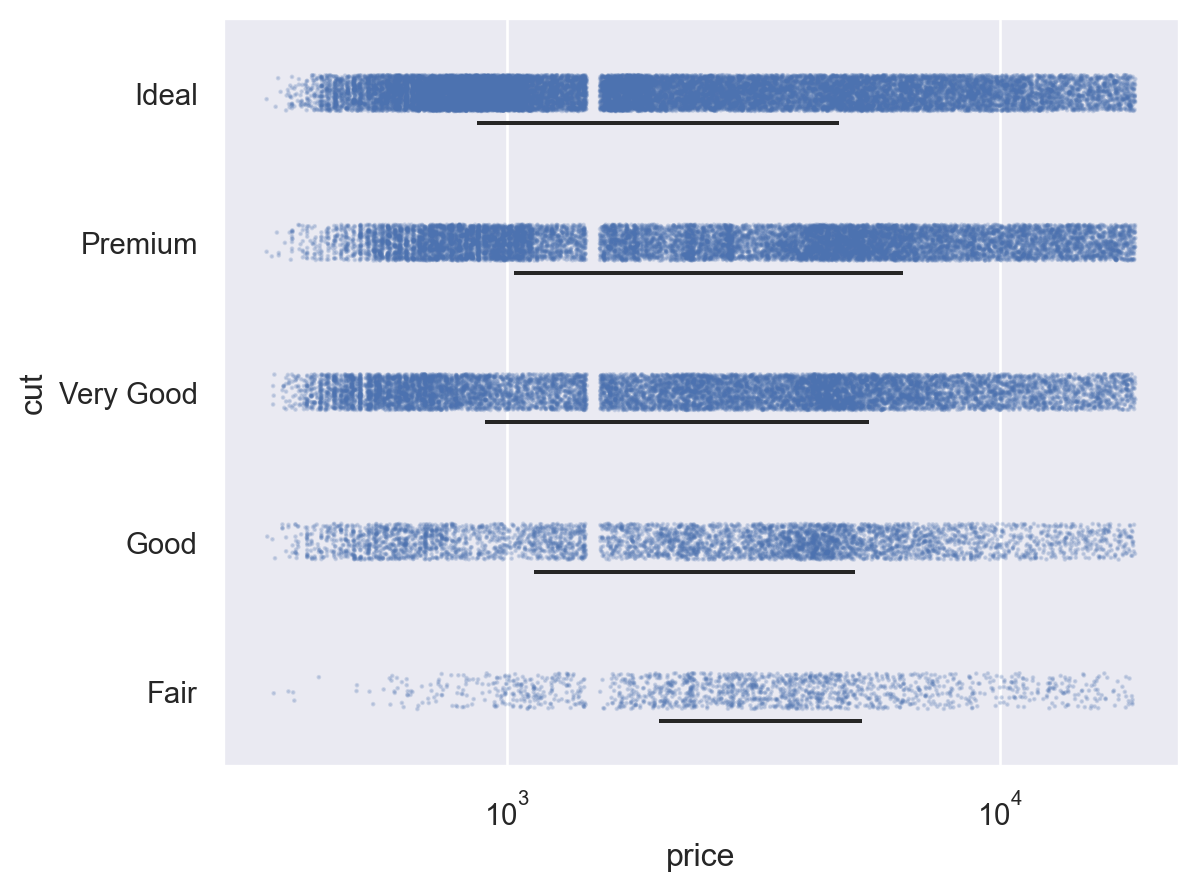
Combine with a range mark to show a percentile interval:
(
    so.Plot(diamonds, "price", "cut")
    .add(so.Dots(pointsize=1, alpha=.2), so.Jitter(.3))
    .add(so.Range(color="k"), so.Perc([25, 75]), so.Shift(y=.2))
    .scale(x="log")
)