seaborn.objects.Agg#
- class seaborn.objects.Agg(func='mean')#
Aggregate data along the value axis using given method.
- Parameters:
- funcstr or callable
Name of a
pandas.Seriesmethod or a vector -> scalar function.
See also
objects.EstAggregation with error bars.
Examples
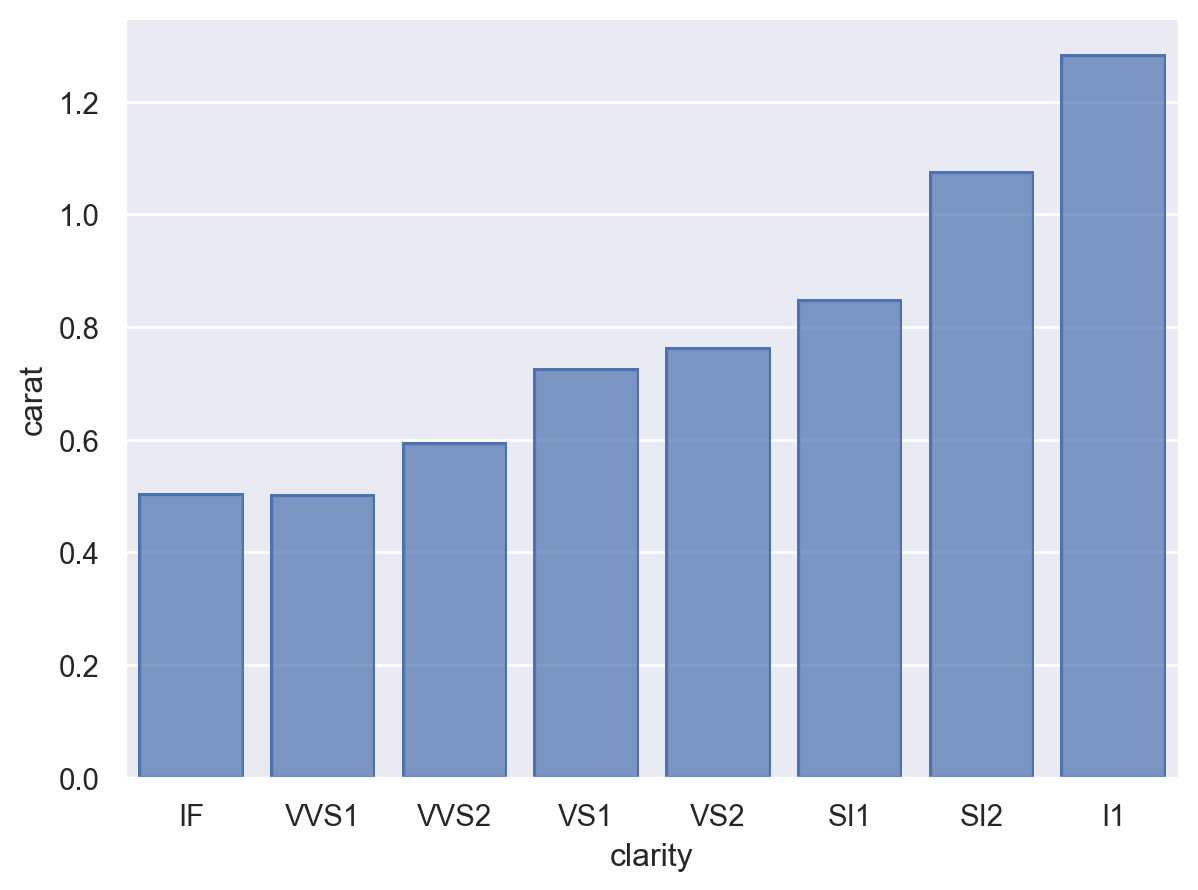
The default behavior is to aggregate by taking a mean over each group:
p = so.Plot(diamonds, "clarity", "carat")
p.add(so.Bar(), so.Agg())
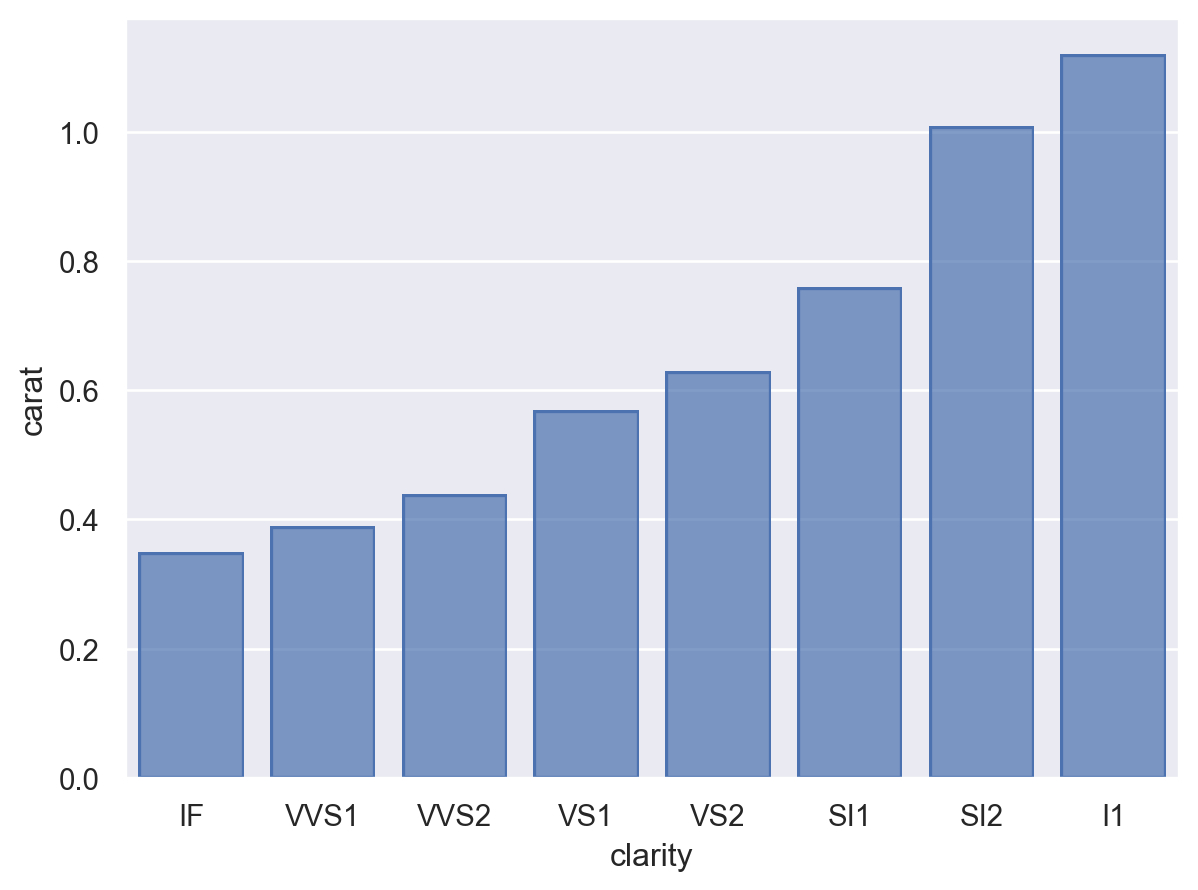
Other aggregation functions can be selected by name if they are pandas methods:
p.add(so.Bar(), so.Agg("median"))
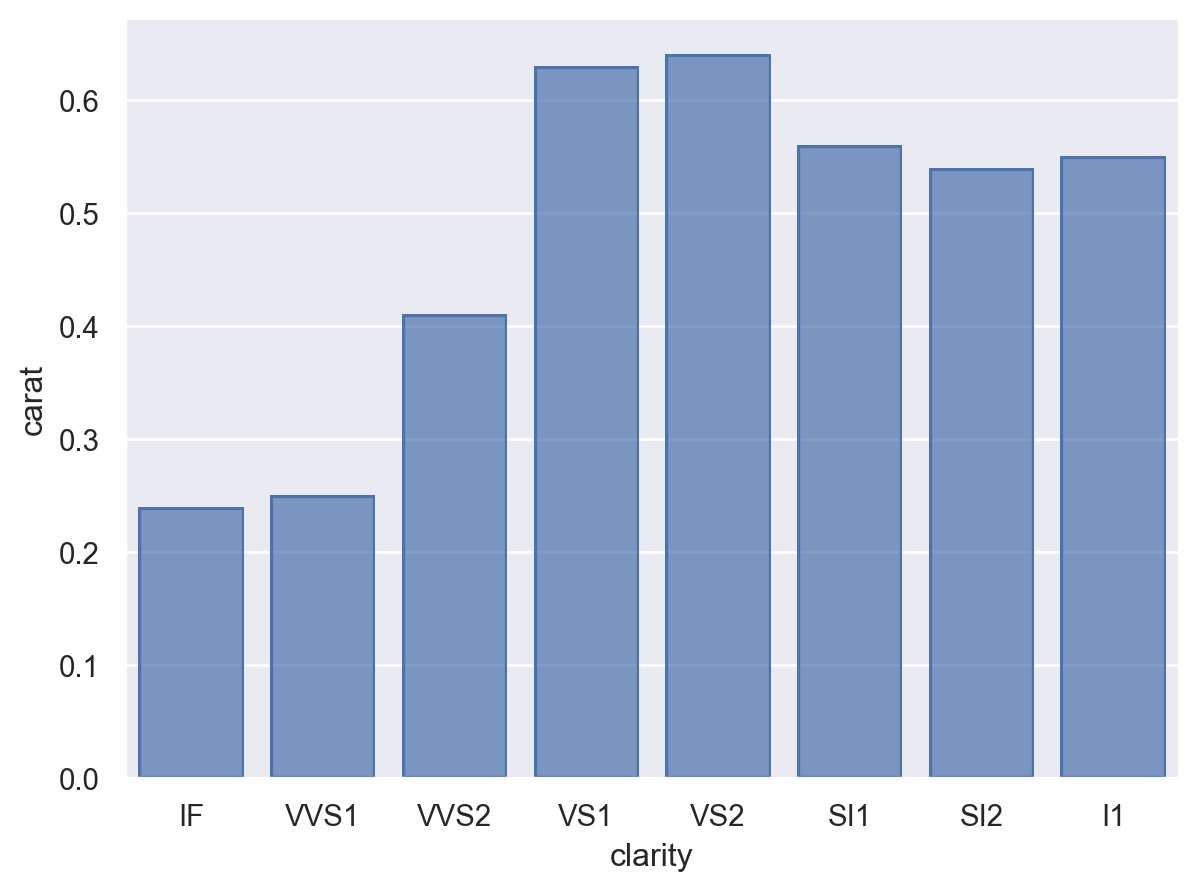
It’s also possible to pass an arbitrary aggregation function:
p.add(so.Bar(), so.Agg(lambda x: x.quantile(.75) - x.quantile(.25)))
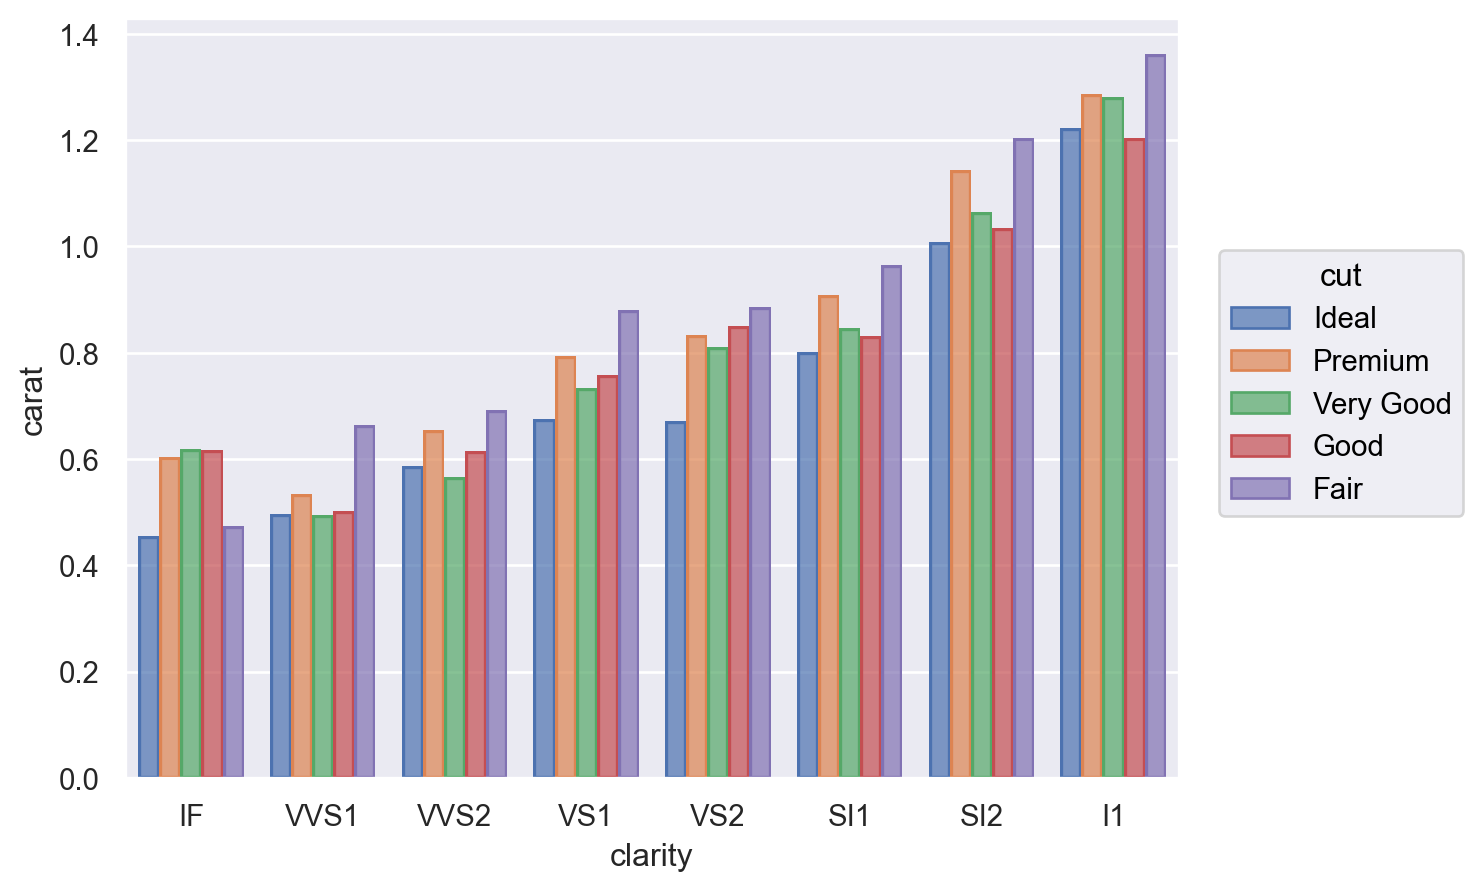
When other mapping variables are assigned, they’ll be used to define aggregation groups. With some marks, it may be helpful to use additional transforms, such as
Dodge:p.add(so.Bar(), so.Agg(), so.Dodge(), color="cut")
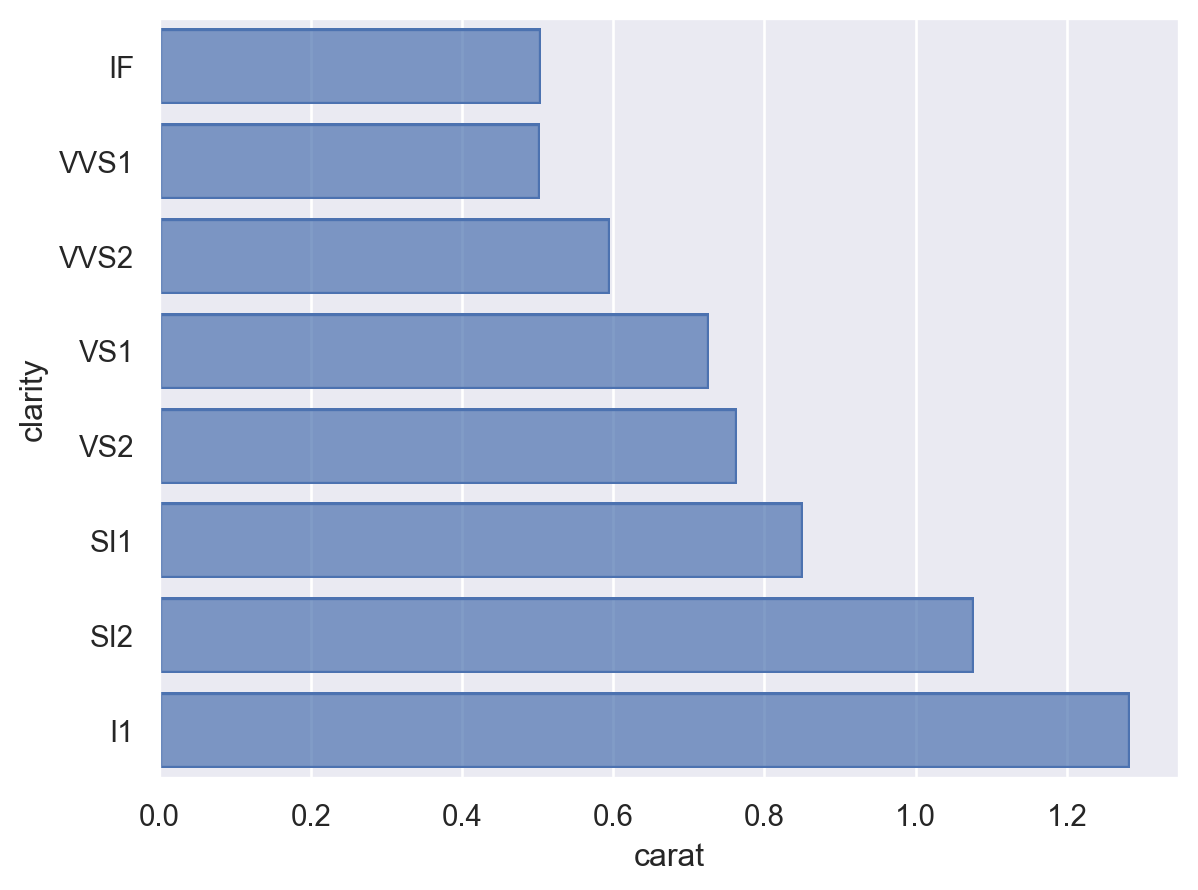
The variable that gets aggregated depends on the orientation of the layer, which is usually inferred from the coordinate variable types (but may also be specified with the
orientparameter inPlot.add()):so.Plot(diamonds, "carat", "clarity").add(so.Bar(), so.Agg())