seaborn.objects.Plot.label#
- Plot.label(*, title=None, legend=None, **variables)#
Control the labels and titles for axes, legends, and subplots.
Additional keywords correspond to variables defined in the plot. Values can be one of the following types:
string (used literally; pass “” to clear the default label)
function (called on the default label)
For coordinate variables, the value sets the axis label. For semantic variables, the value sets the legend title. For faceting variables,
title=modifies the subplot-specific label, whilecol=and/orrow=add a label for the faceting variable.When using a single subplot,
title=sets its title.The
legend=parameter sets the title for the “layer” legend (i.e., when usinglabelinPlot.add()).Examples
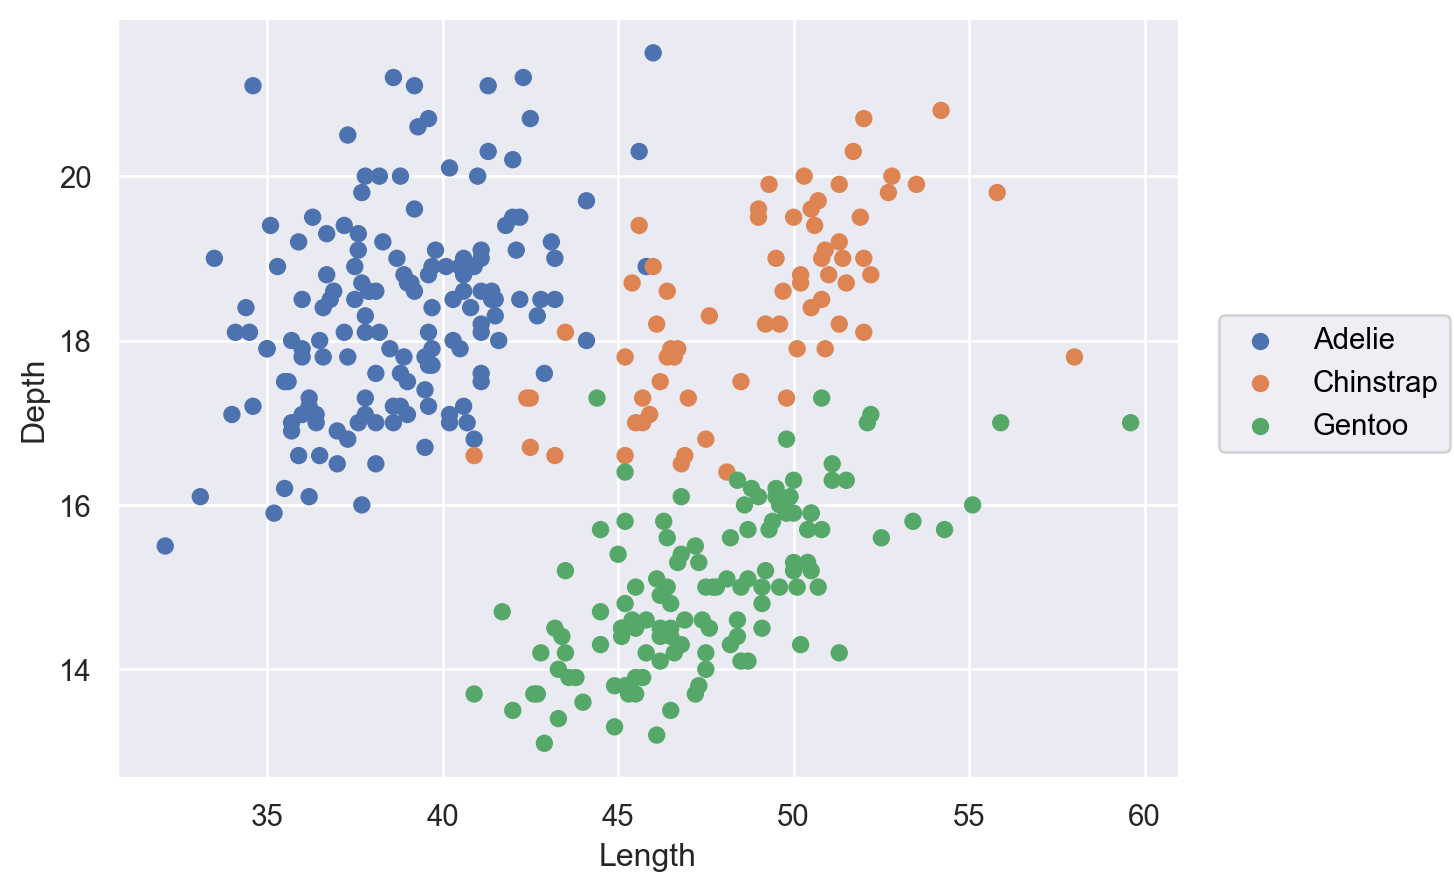
Use strings to override default labels:
p = (
    so.Plot(penguins, x="bill_length_mm", y="bill_depth_mm")
    .add(so.Dot(), color="species")
)
p.label(x="Length", y="Depth", color="")
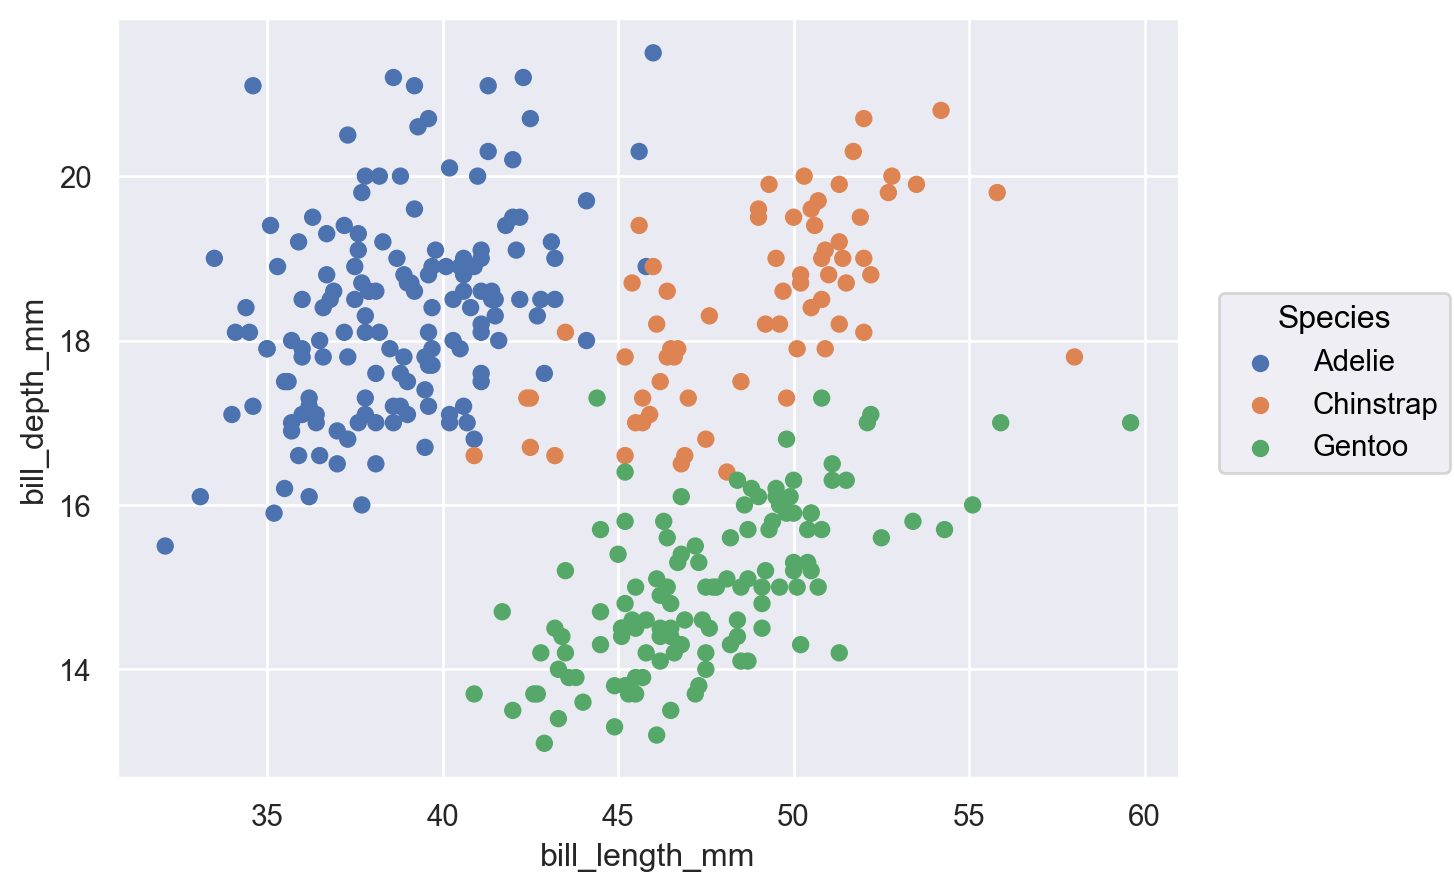
Pass a function to modify the default label:
p.label(color=str.capitalize)
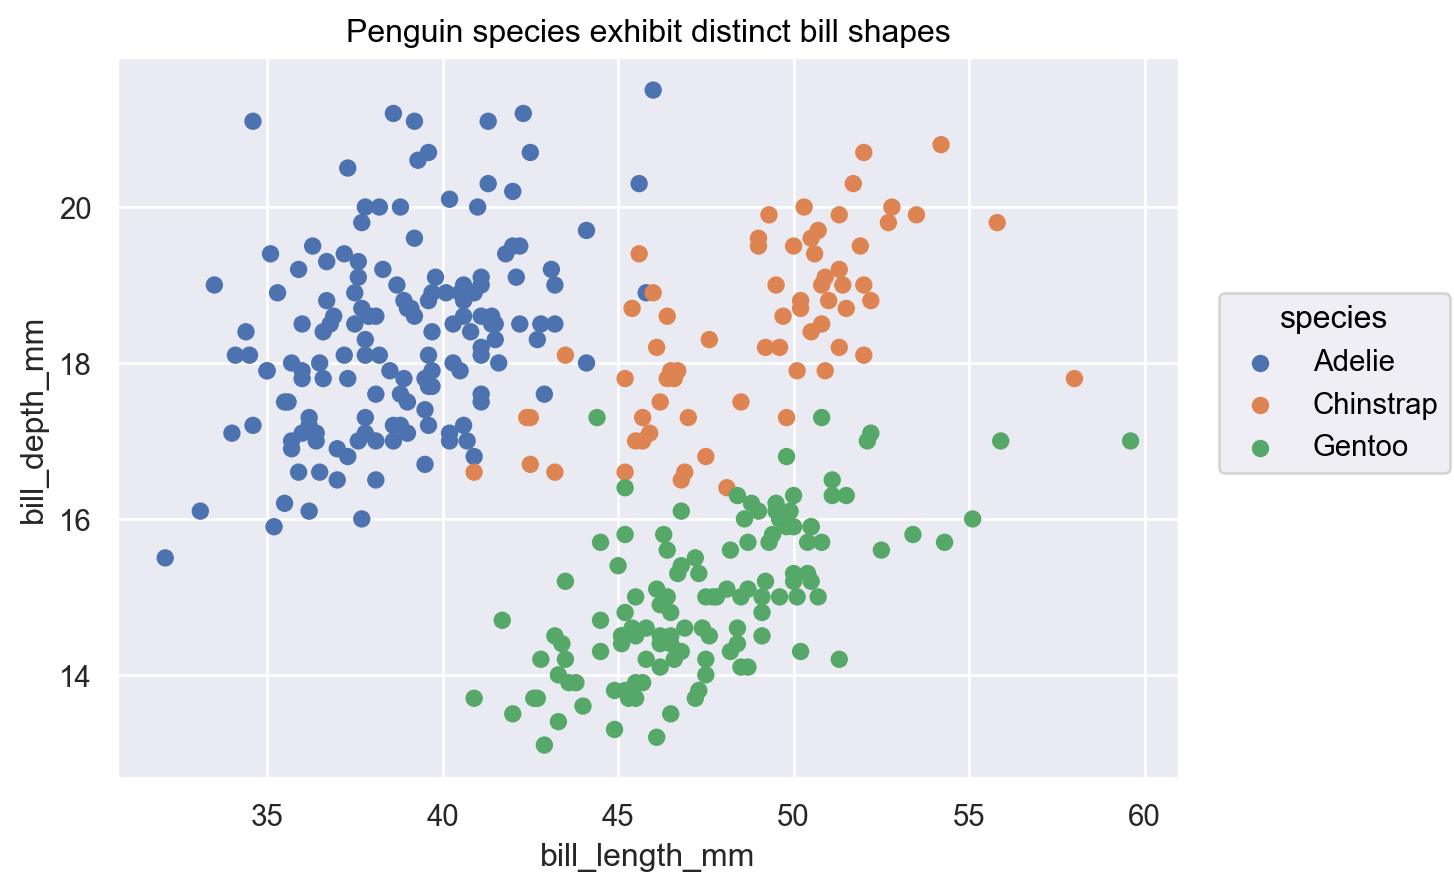
Use this method to set the title for a single-axes plot:
p.label(title="Penguin species exhibit distinct bill shapes")
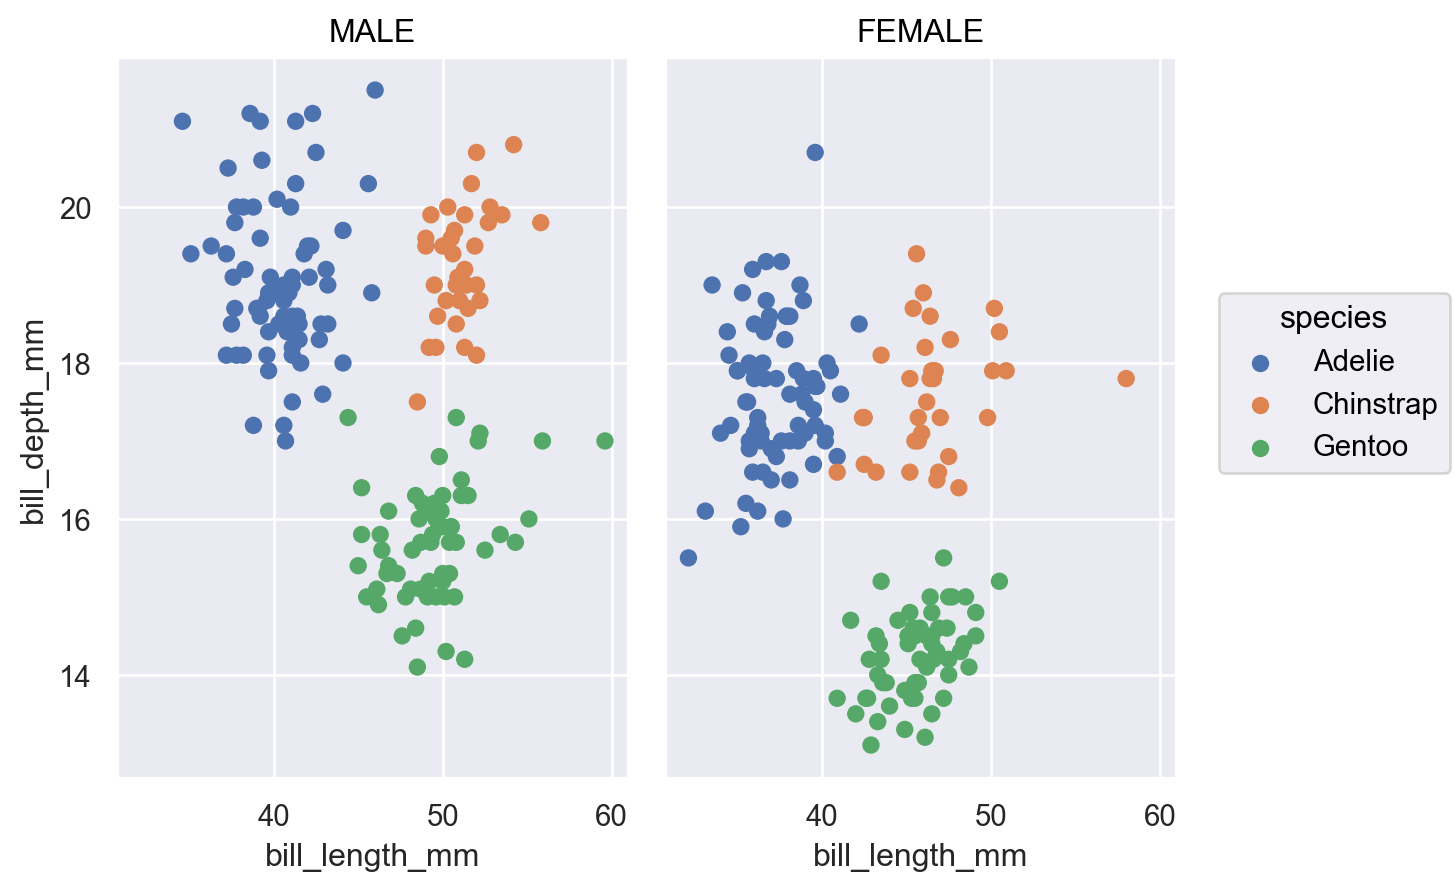
When faceting, the
titleparameter will modify default titles:p.facet("sex").label(title=str.upper)
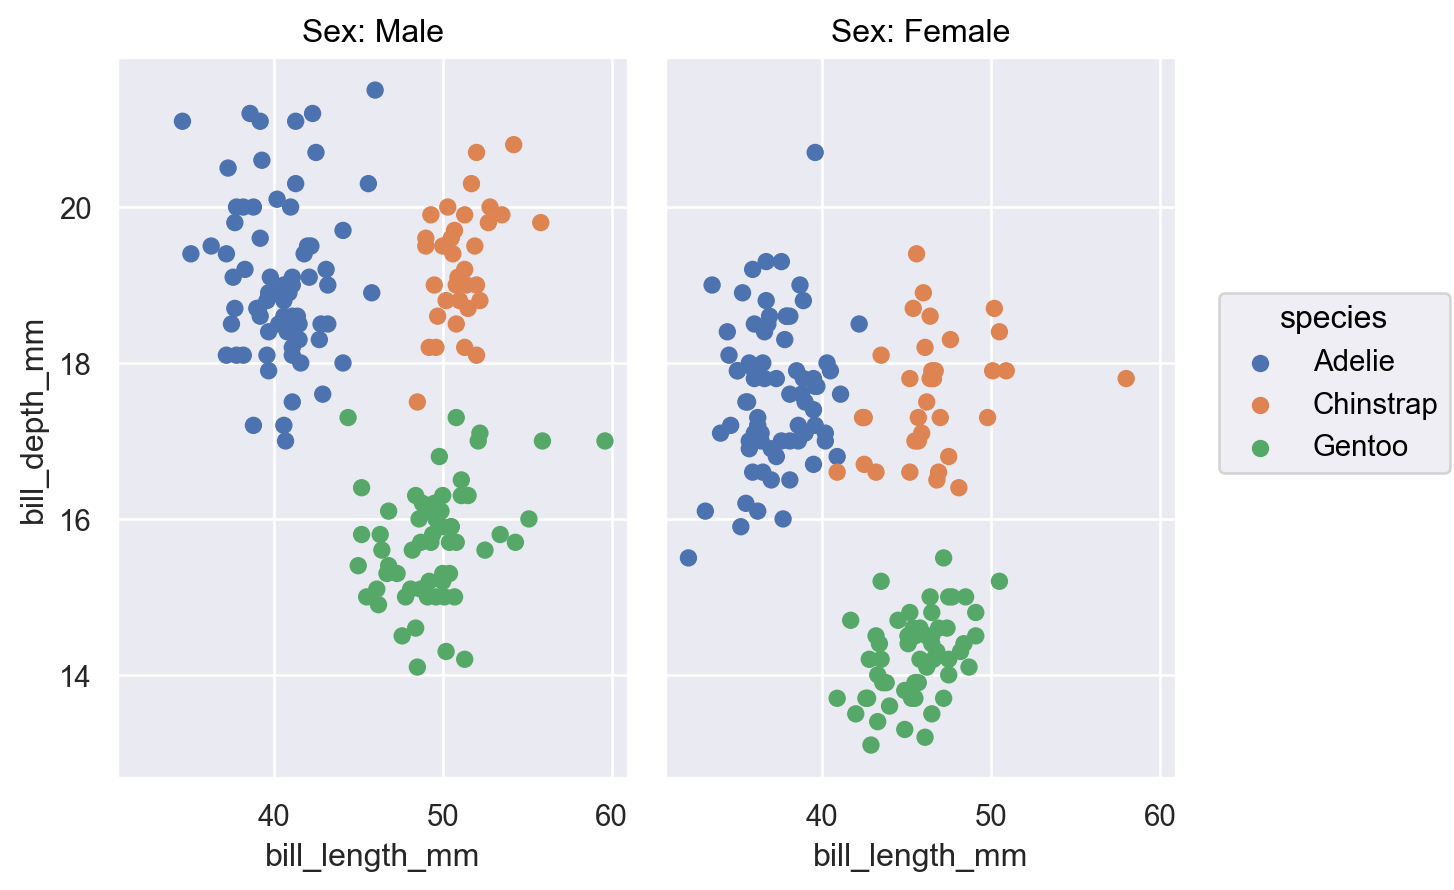
And the
col/rowparameters will add labels to the title for each facet:p.facet("sex").label(col="Sex:")
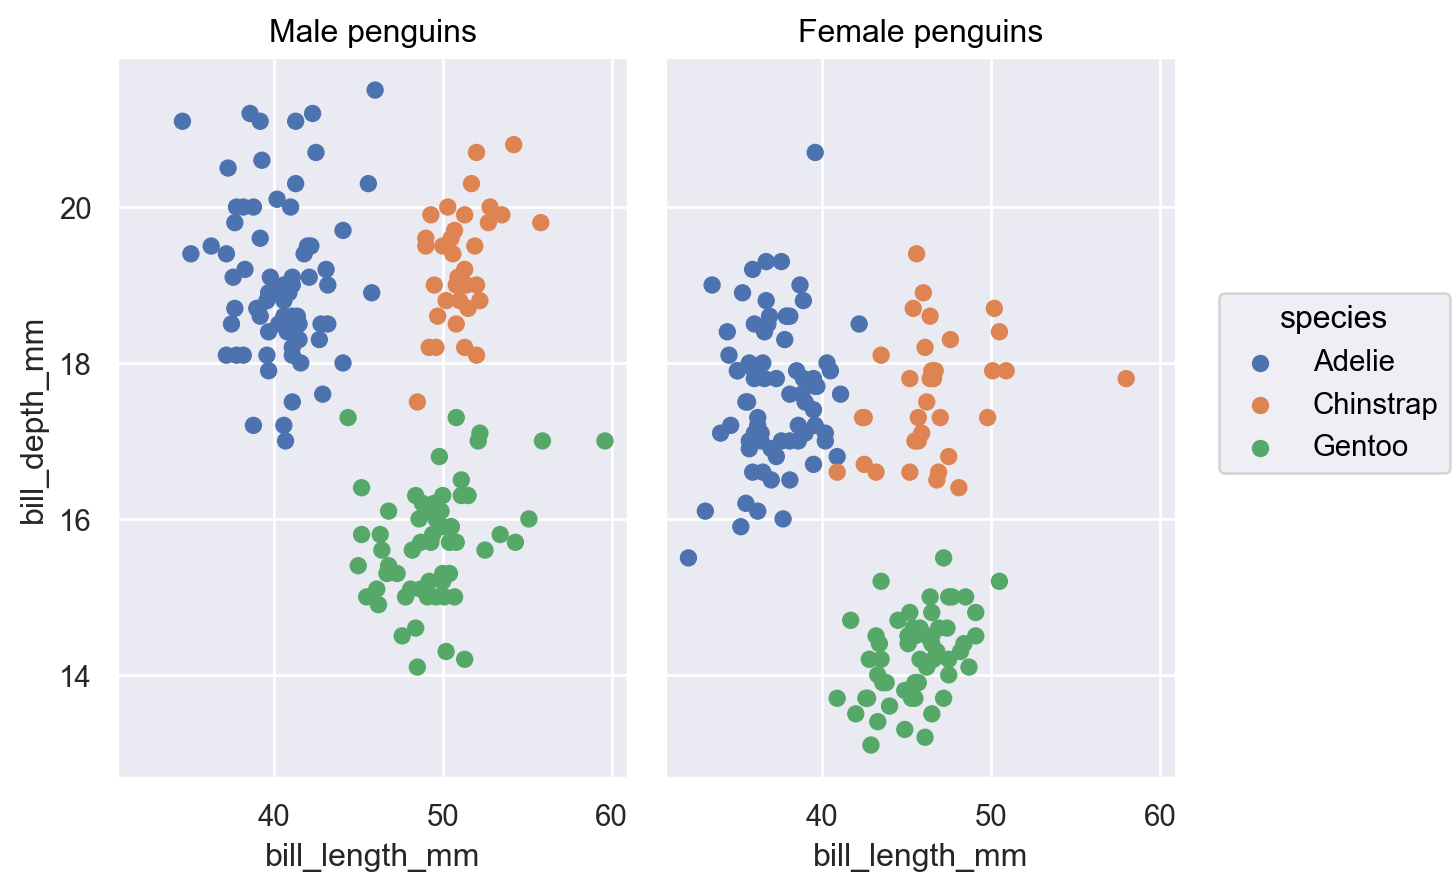
If more customization is needed, a format string can work well:
p.facet("sex").label(title="{} penguins".format)
p
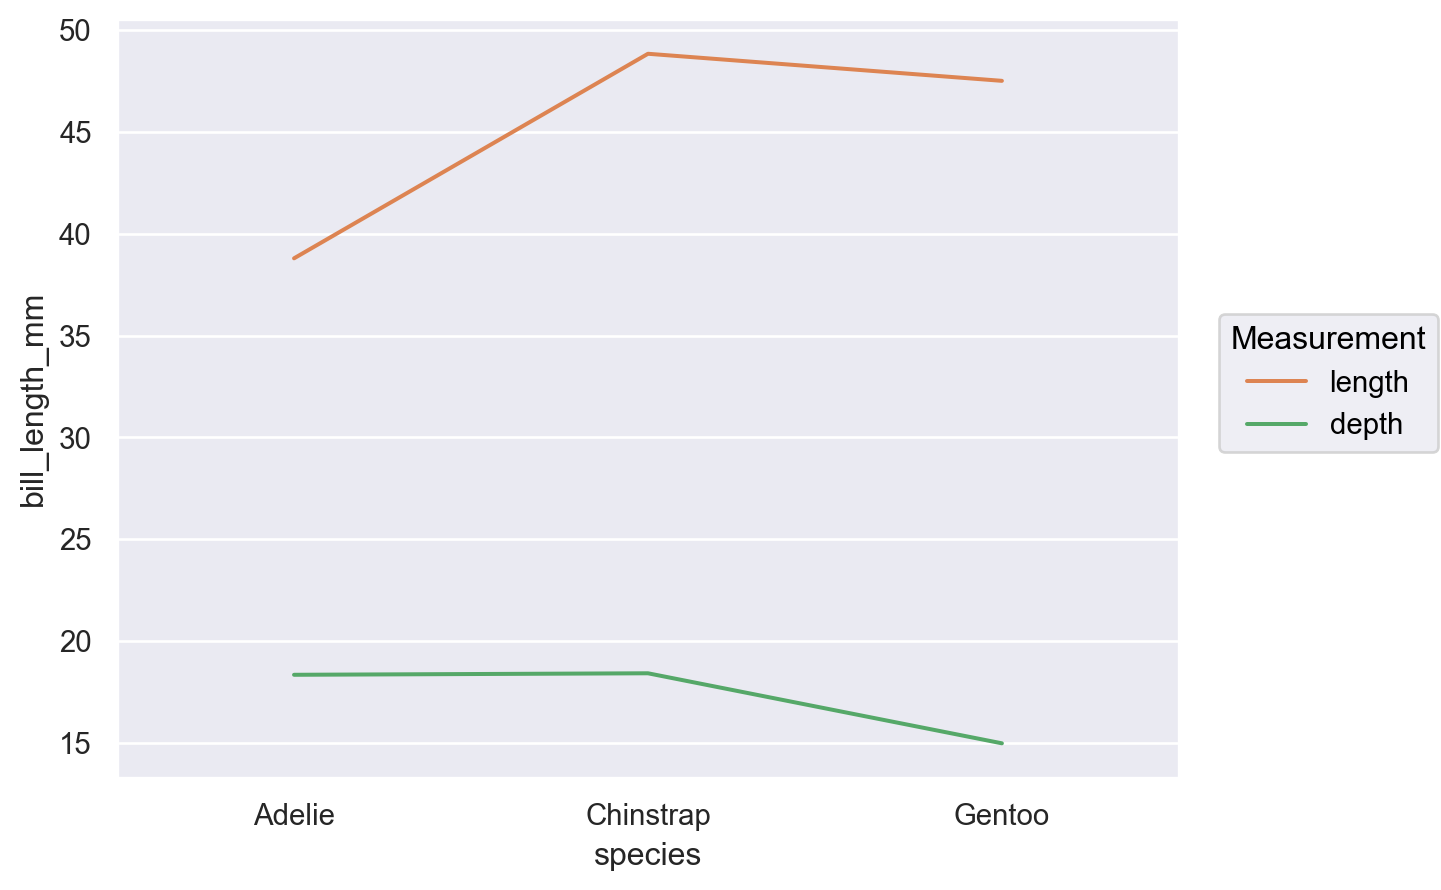
When adding labels for each layer, the
legend=parameter sets the title for the legend:( so.Plot(penguins, x="species") .add(so.Line(color="C1"), so.Agg(), y="bill_length_mm", label="length") .add(so.Line(color="C2"), so.Agg(), y="bill_depth_mm", label="depth") .label(legend="Measurement") )