seaborn.objects.Plot.theme#
- Plot.theme(config, /)#
Control the appearance of elements in the plot.
Note
The API for customizing plot appearance is not yet finalized. Currently, the only valid argument is a dict of matplotlib rc parameters. (This dict must be passed as a positional argument.)
It is likely that this method will be enhanced in future releases.
Matplotlib rc parameters are documented on the following page: https://matplotlib.org/stable/tutorials/introductory/customizing.html
Examples
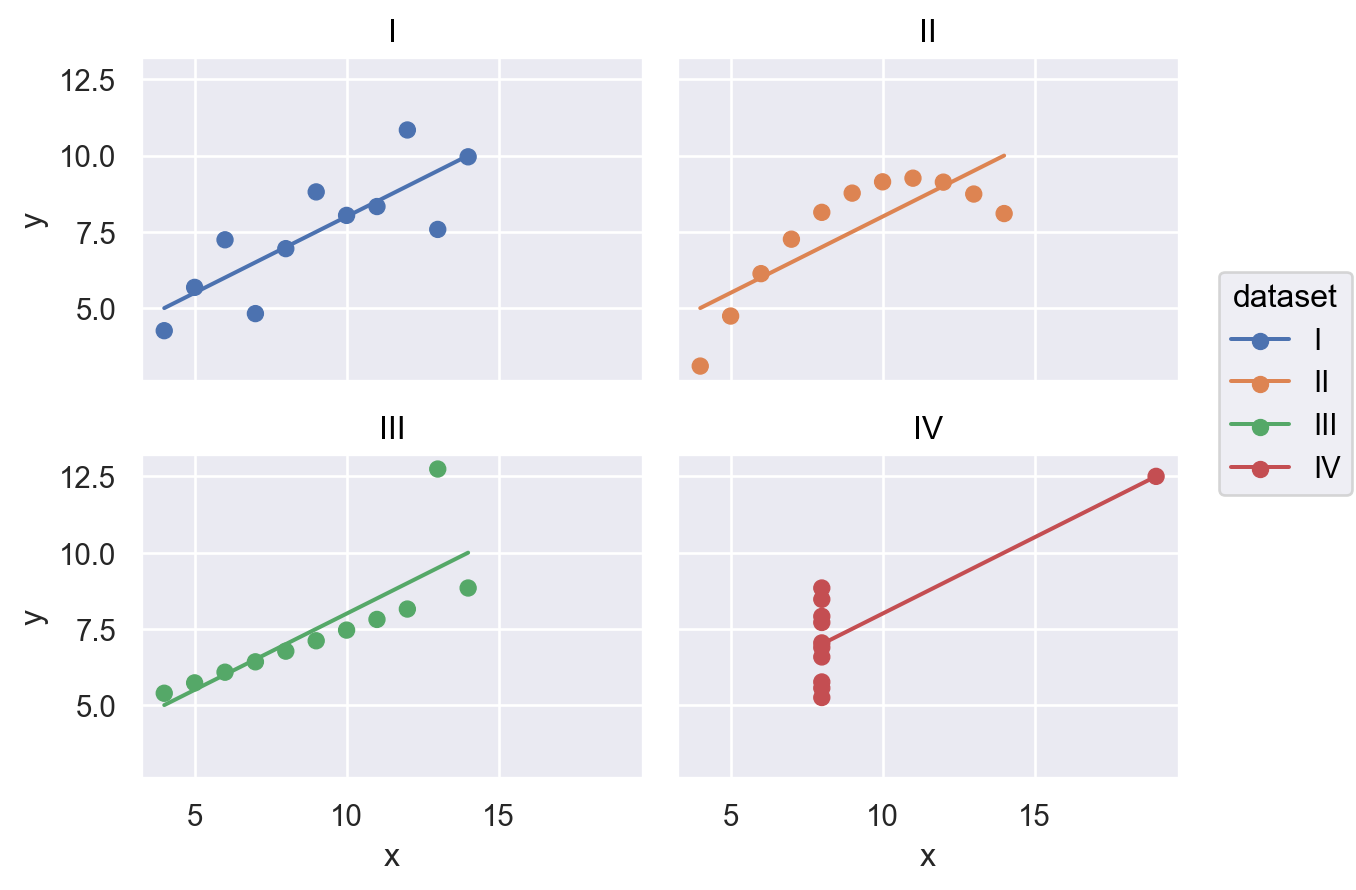
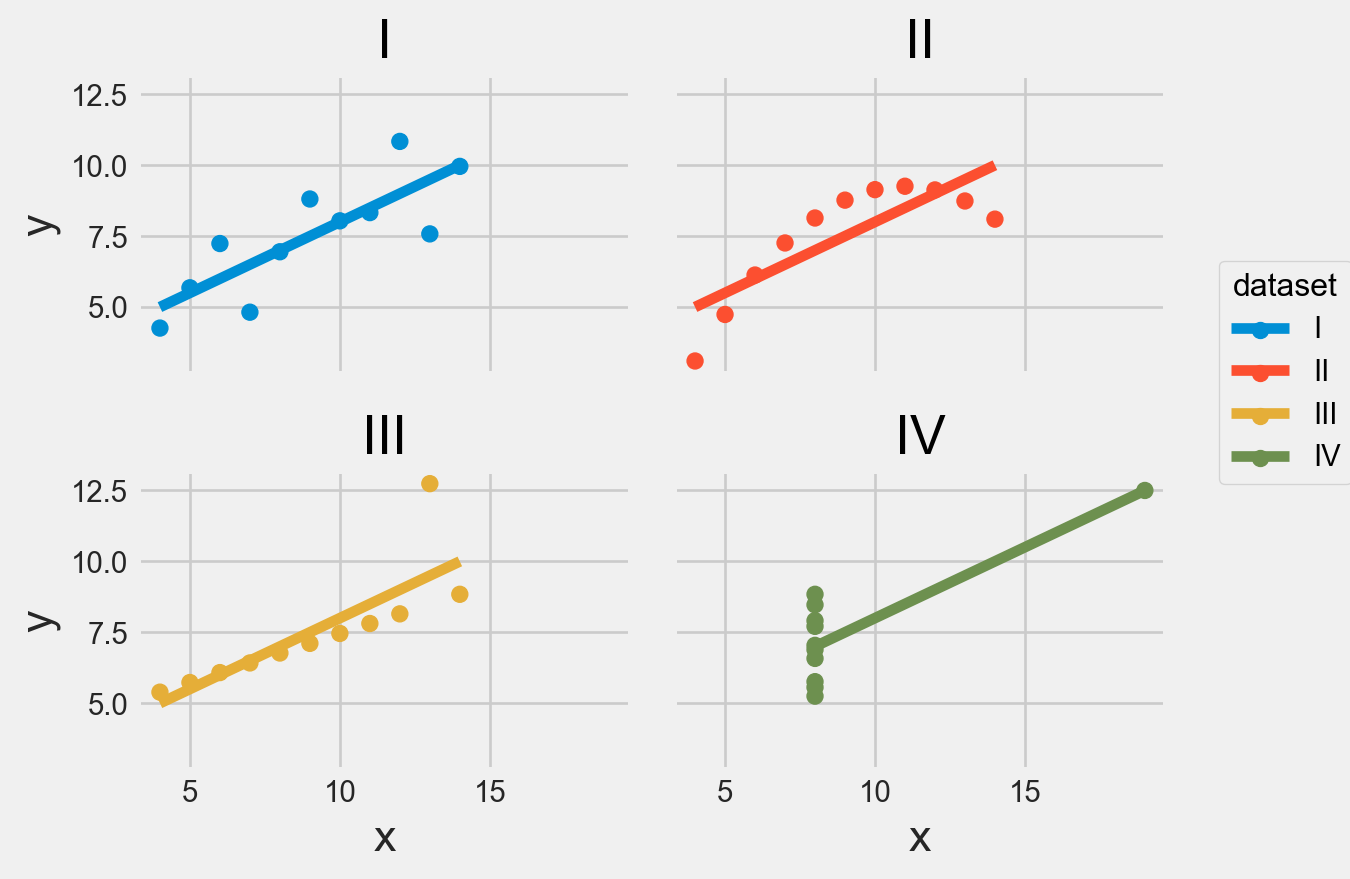
The default theme uses the same parameters as
seaborn.set_theme()with no additional arguments:p = ( so.Plot(anscombe, "x", "y", color="dataset") .facet("dataset", wrap=2) .add(so.Line(), so.PolyFit(order=1)) .add(so.Dot()) ) p
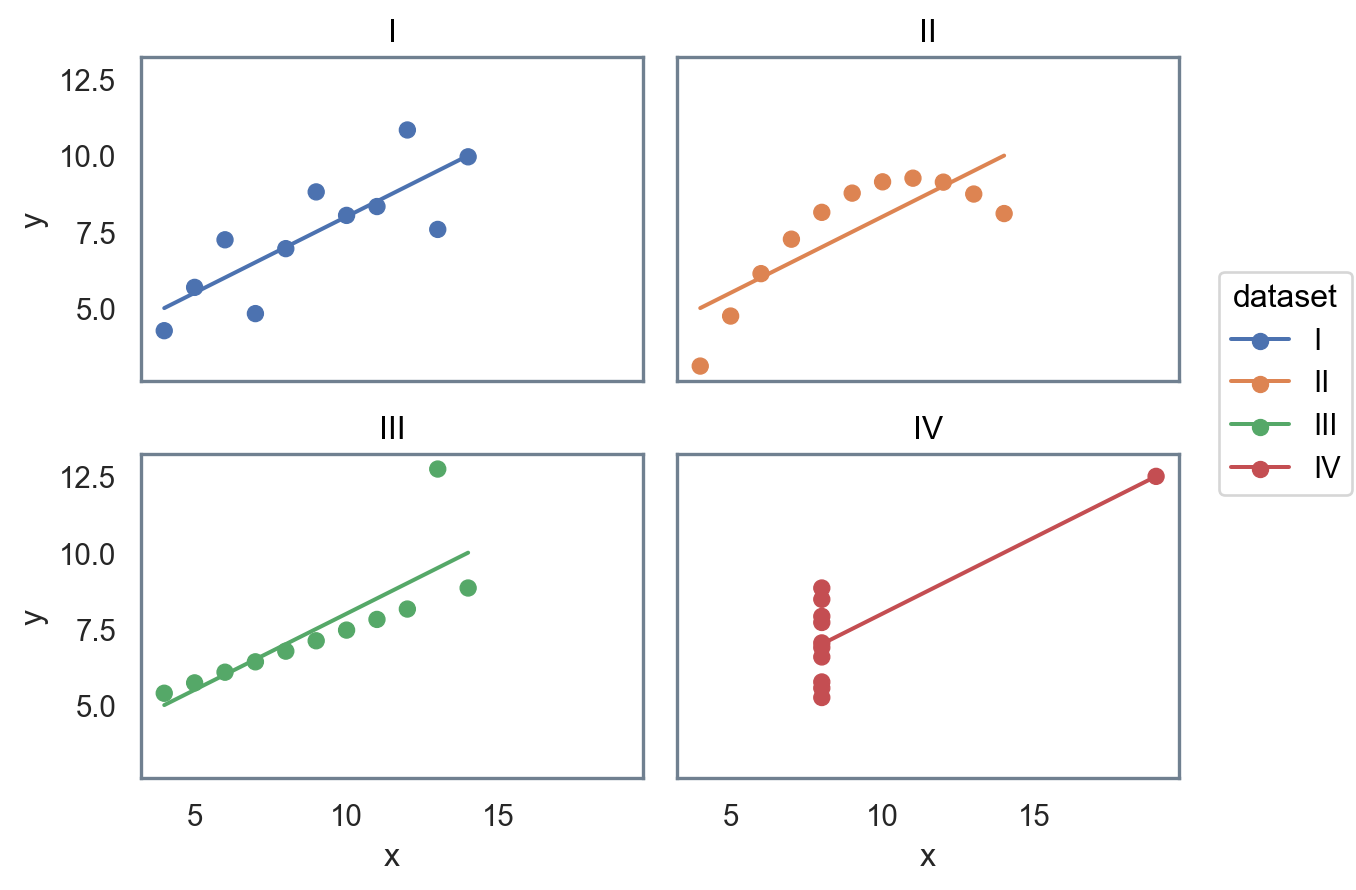
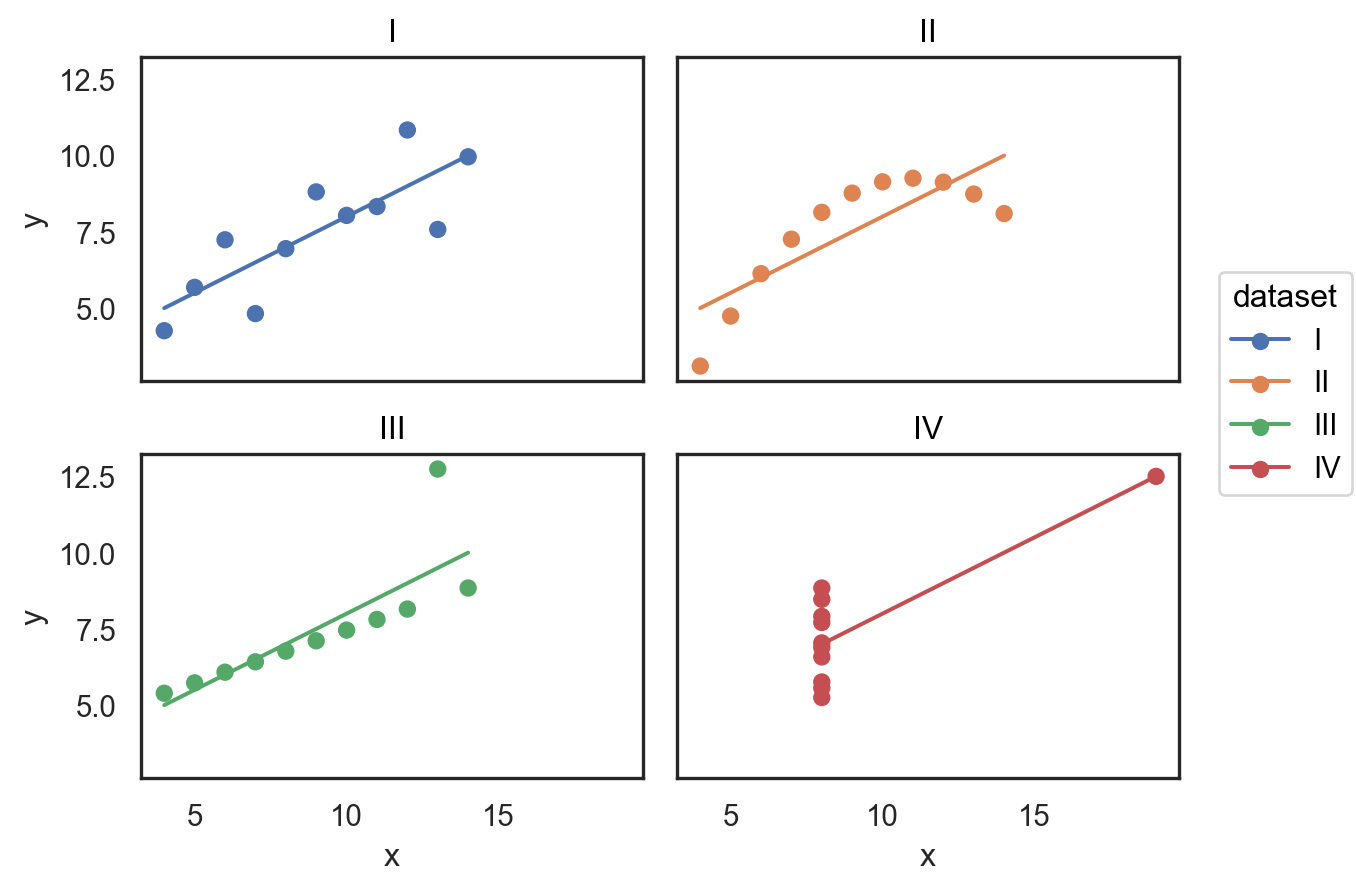
Pass a dictionary of rc parameters to change the appearance of the plot:
p.theme({"axes.facecolor": "w", "axes.edgecolor": "slategray"})
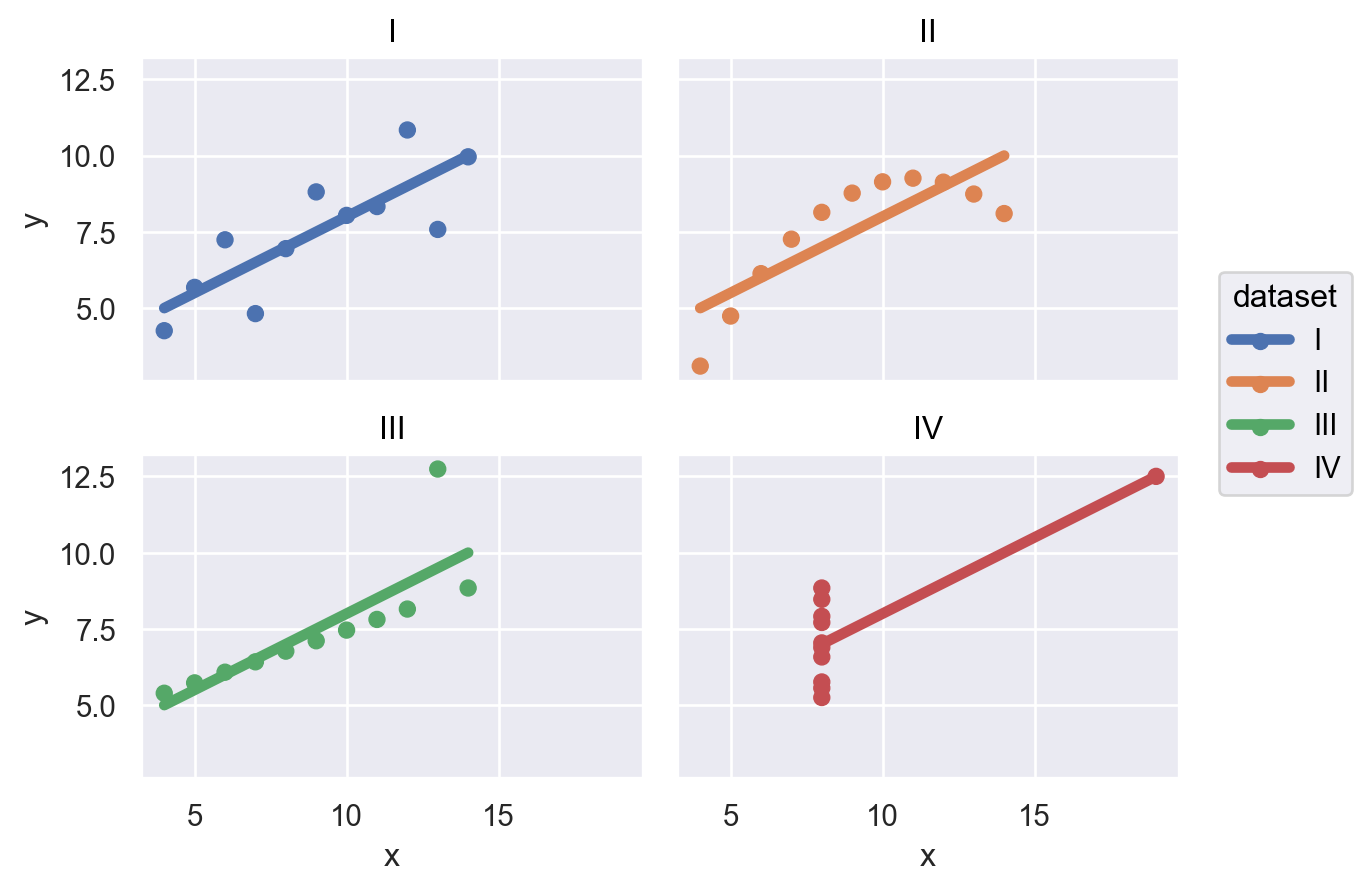
Many (though not all) mark properties will reflect theme parameters by default:
p.theme({"lines.linewidth": 4})
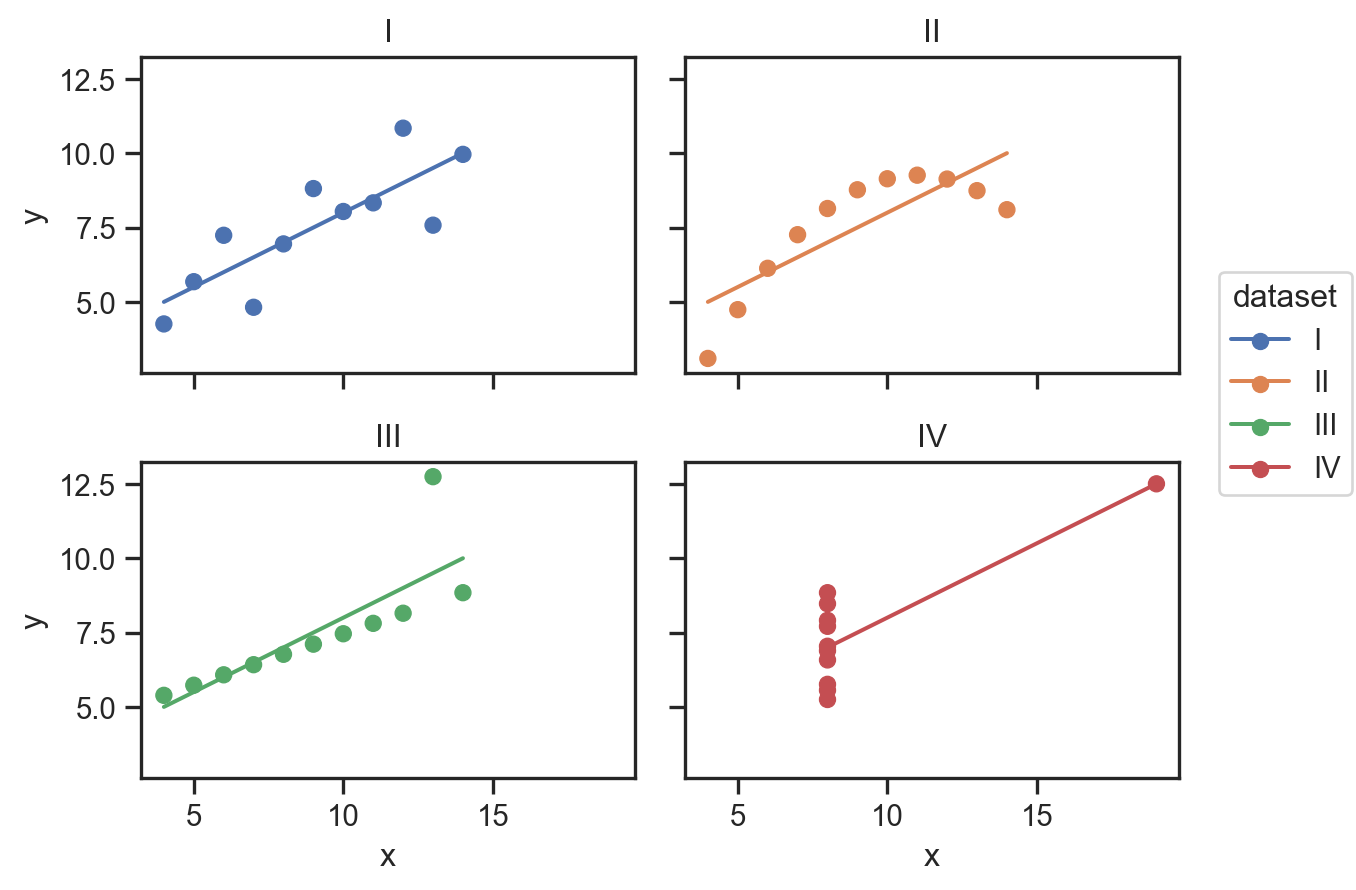
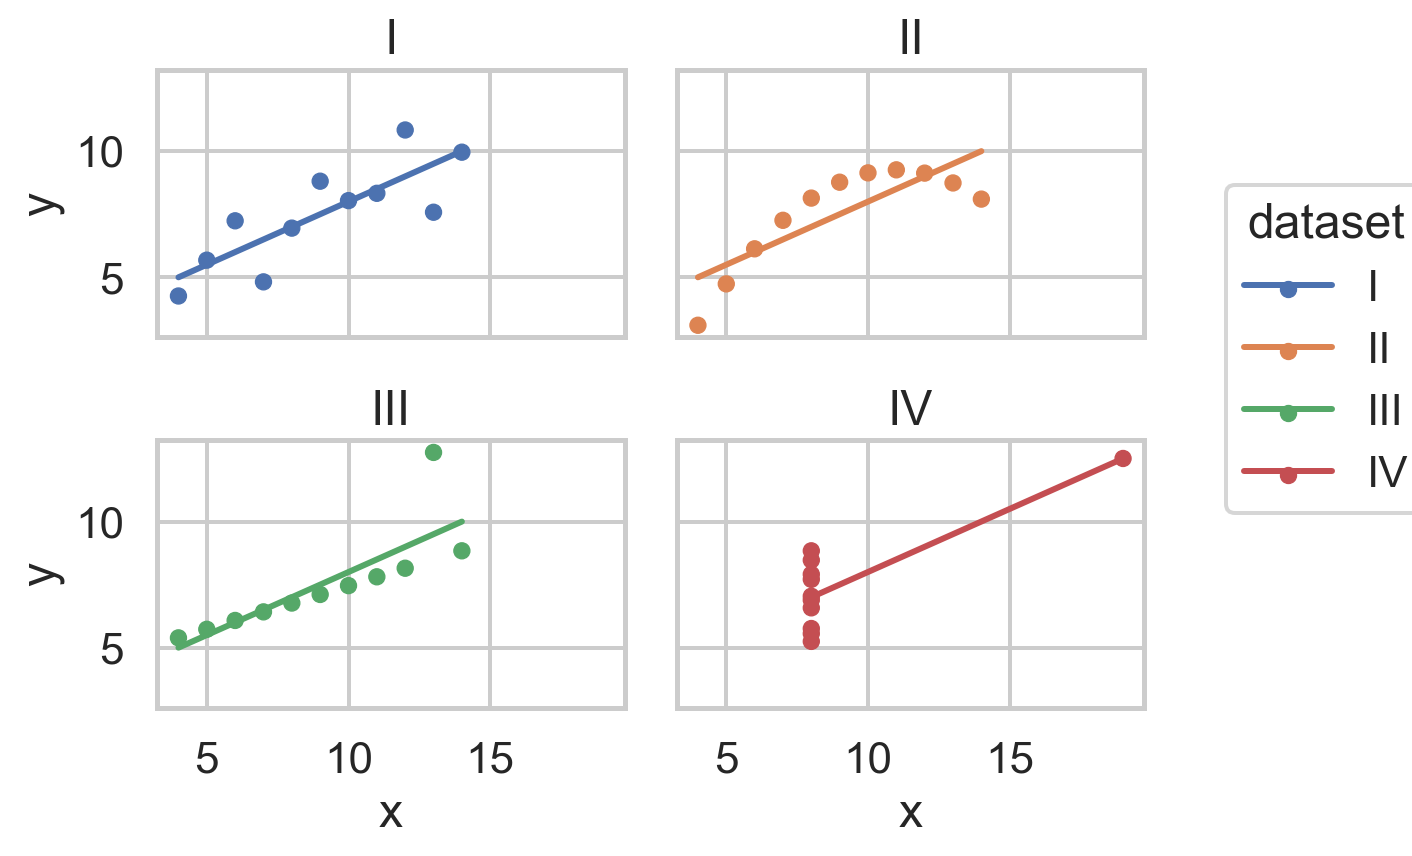
Apply seaborn styles by passing in the output of the style functions:
from seaborn import axes_style
p.theme(axes_style("ticks"))
Or apply styles that ship with matplotlib:
from matplotlib import style
p.theme(style.library["fivethirtyeight"])
Multiple parameter dictionaries should be passed to the same function call. On Python 3.9+, you can use dictionary union syntax for this:
from seaborn import plotting_context
p.theme(axes_style("whitegrid") | plotting_context("talk"))
The default theme for all
Plotinstances can be changed using thePlot.configattribute:so.Plot.config.theme.update(axes_style("white")) p
See Plot Configuration for more details.