seaborn.set_style#
- seaborn.set_style(style=None, rc=None)#
Set the parameters that control the general style of the plots.
The style parameters control properties like the color of the background and whether a grid is enabled by default. This is accomplished using the matplotlib rcParams system.
The options are illustrated in the aesthetics tutorial.
See
axes_style()to get the parameter values.- Parameters:
- styledict, or one of {darkgrid, whitegrid, dark, white, ticks}
A dictionary of parameters or the name of a preconfigured style.
- rcdict, optional
Parameter mappings to override the values in the preset seaborn style dictionaries. This only updates parameters that are considered part of the style definition.
Examples
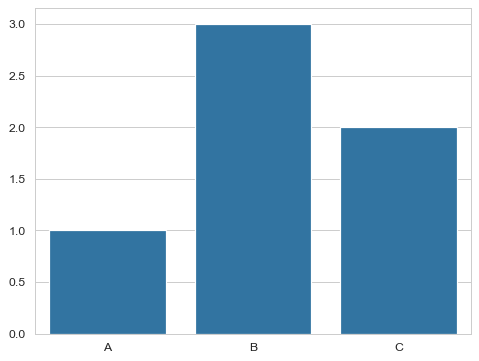
Call the function with the name of a seaborn style to set the default for all plots:
sns.set_style("whitegrid")
sns.barplot(x=["A", "B", "C"], y=[1, 3, 2])
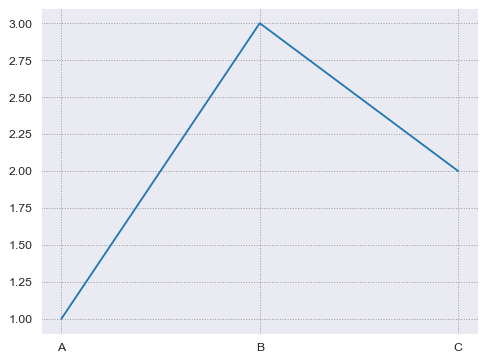
You can also selectively override seaborn’s default parameter values:
sns.set_style("darkgrid", {"grid.color": ".6", "grid.linestyle": ":"})
sns.lineplot(x=["A", "B", "C"], y=[1, 3, 2])