seaborn.objects.Line#
- class seaborn.objects.Line(artist_kws=<factory>, color=<'C0'>, alpha=<1>, linewidth=<rc:lines.linewidth>, linestyle=<rc:lines.linestyle>, marker=<rc:lines.marker>, pointsize=<rc:lines.markersize>, fillcolor=<depend:color>, edgecolor=<depend:color>, edgewidth=<rc:lines.markeredgewidth>)#
A mark connecting data points with sorting along the orientation axis.
- This mark defines the following properties:
color, alpha, linewidth, linestyle, marker, pointsize, fillcolor, edgecolor, edgewidth
See also
Examples
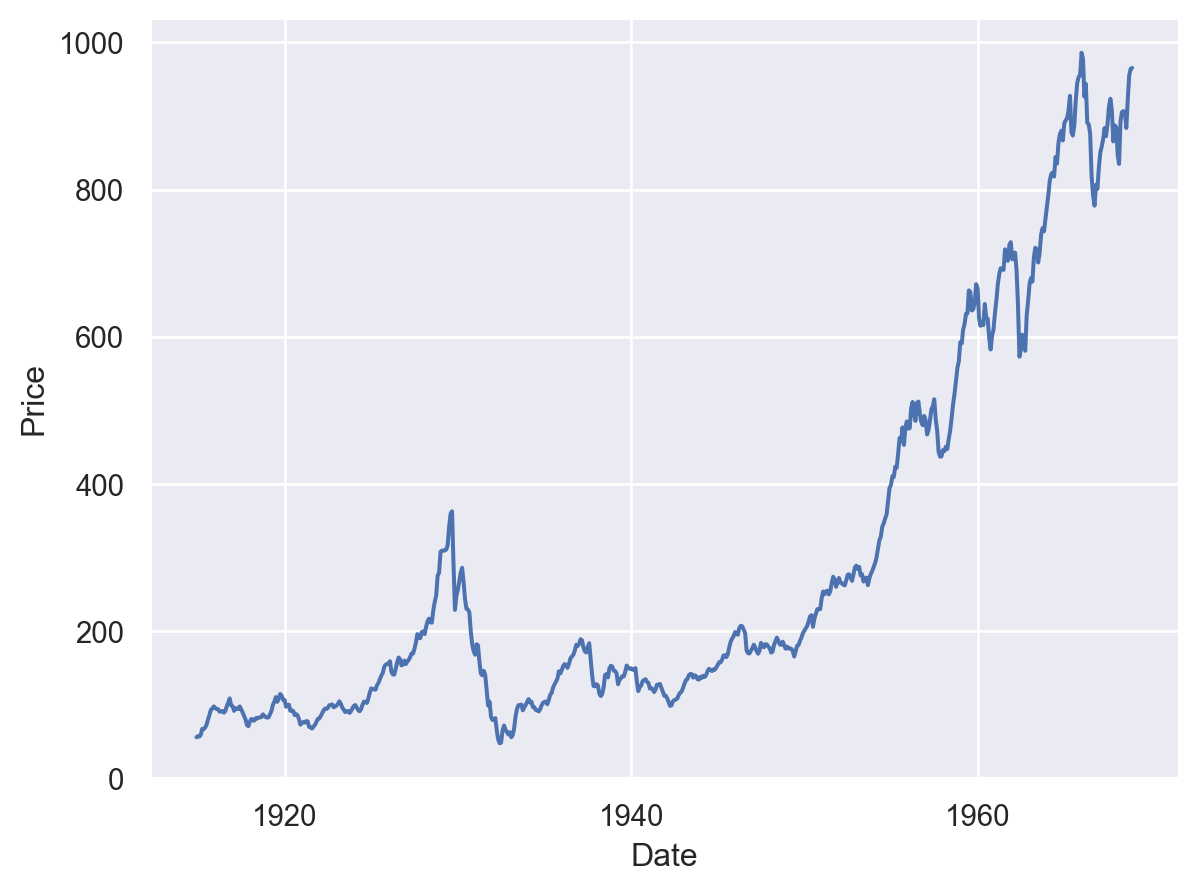
The mark draws a connecting line between sorted observations:
so.Plot(dowjones, "Date", "Price").add(so.Line())
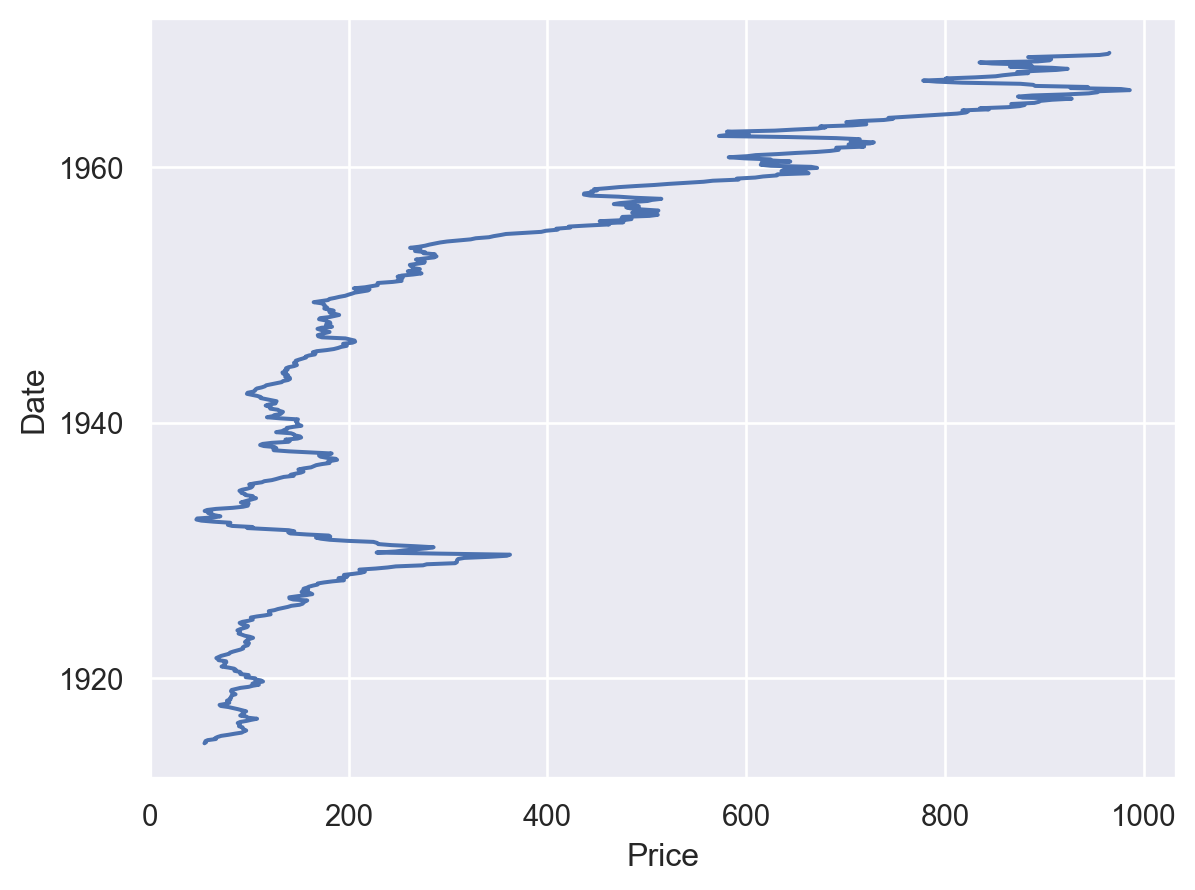
Change the orientation to connect observations along the opposite axis (
orient="y"is redundant here; the plot would detect that the date variable has a lower orientation priority than the price variable):so.Plot(dowjones, x="Price", y="Date").add(so.Line(), orient="y")
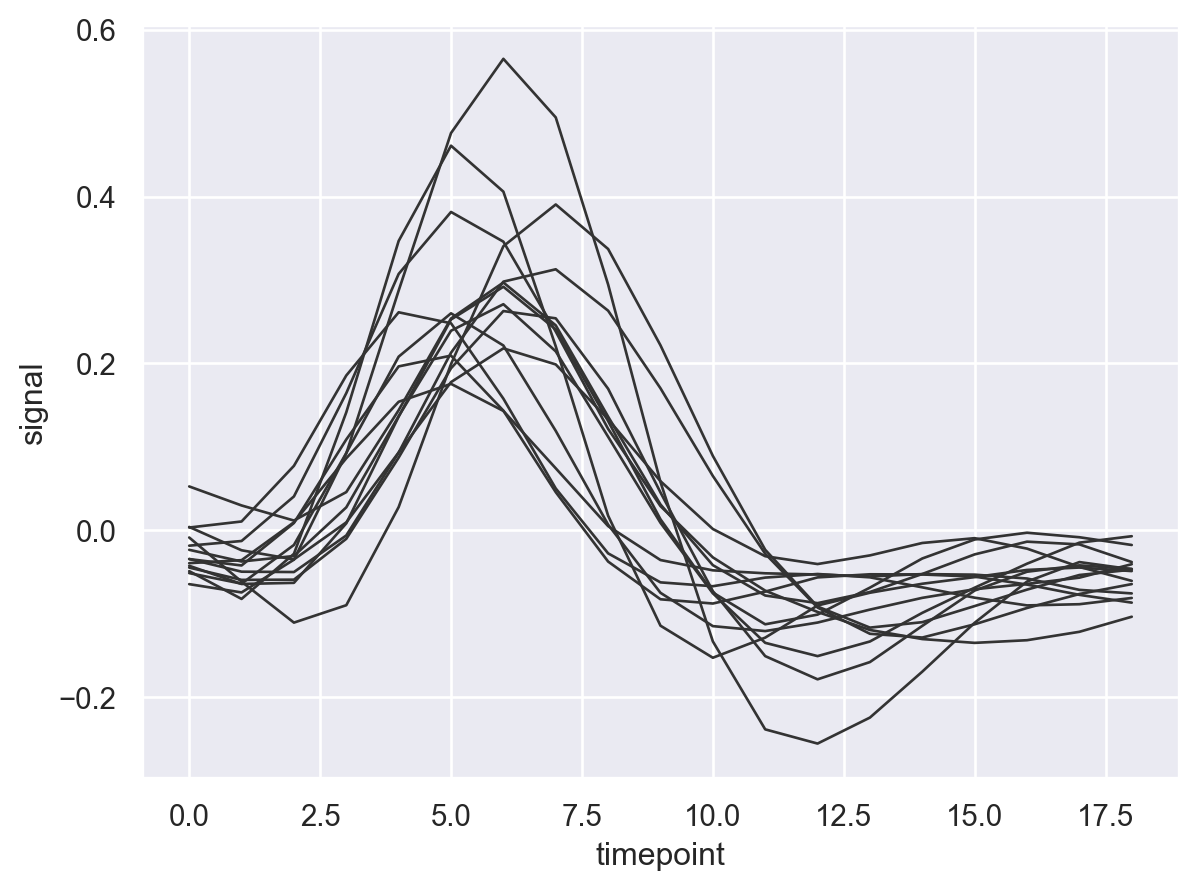
To replicate the same line multiple times, assign a
groupvariable (but consider usingLineshere instead):( fmri .query("region == 'parietal' and event == 'stim'") .pipe(so.Plot, "timepoint", "signal") .add(so.Line(color=".2", linewidth=1), group="subject") )
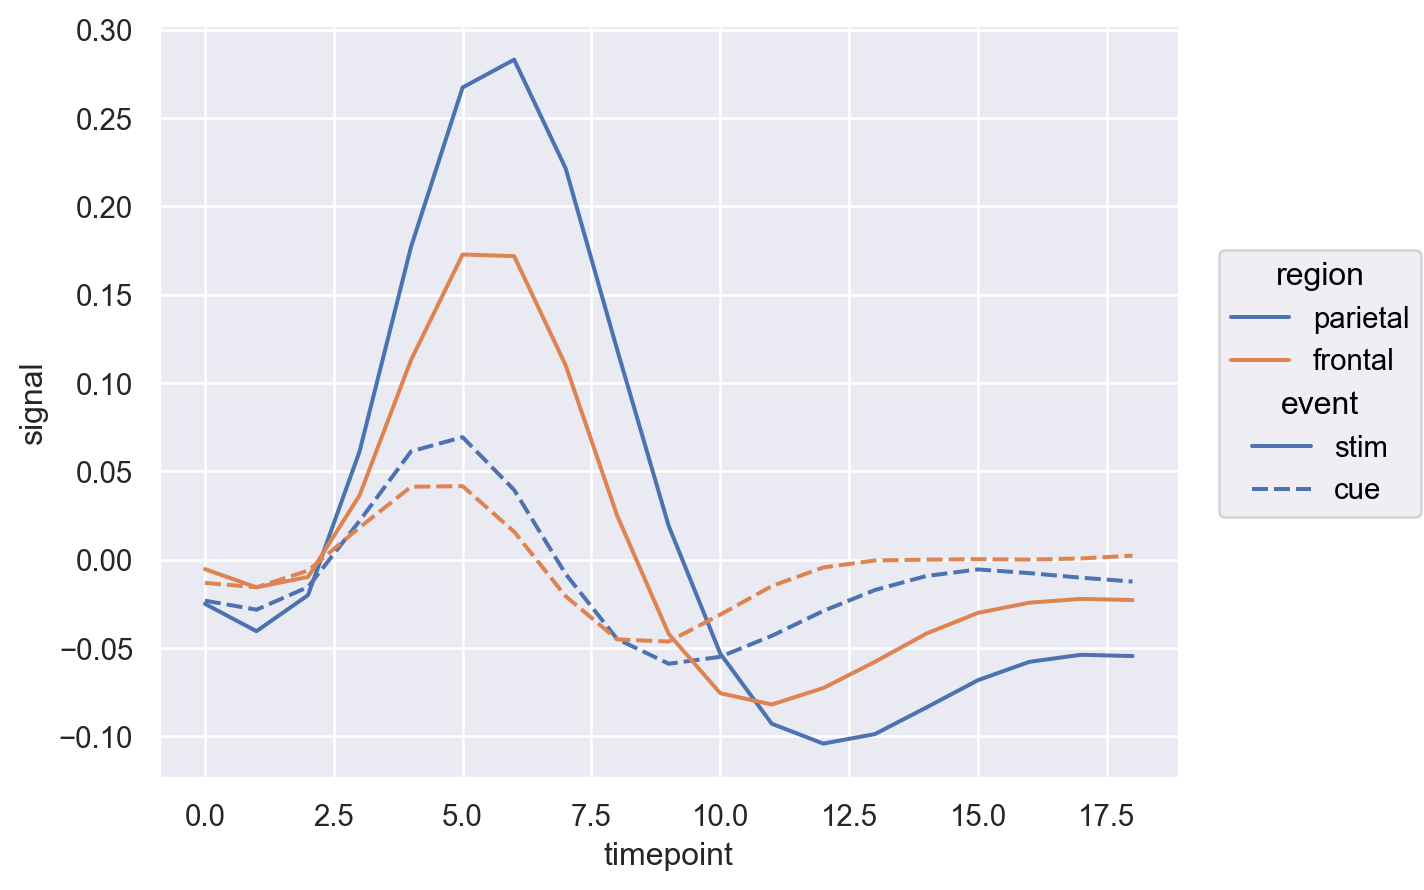
When mapping variables to properties like
colororlinestyle, stat transforms are computed within each grouping:p = so.Plot(fmri, "timepoint", "signal", color="region", linestyle="event") p.add(so.Line(), so.Agg())
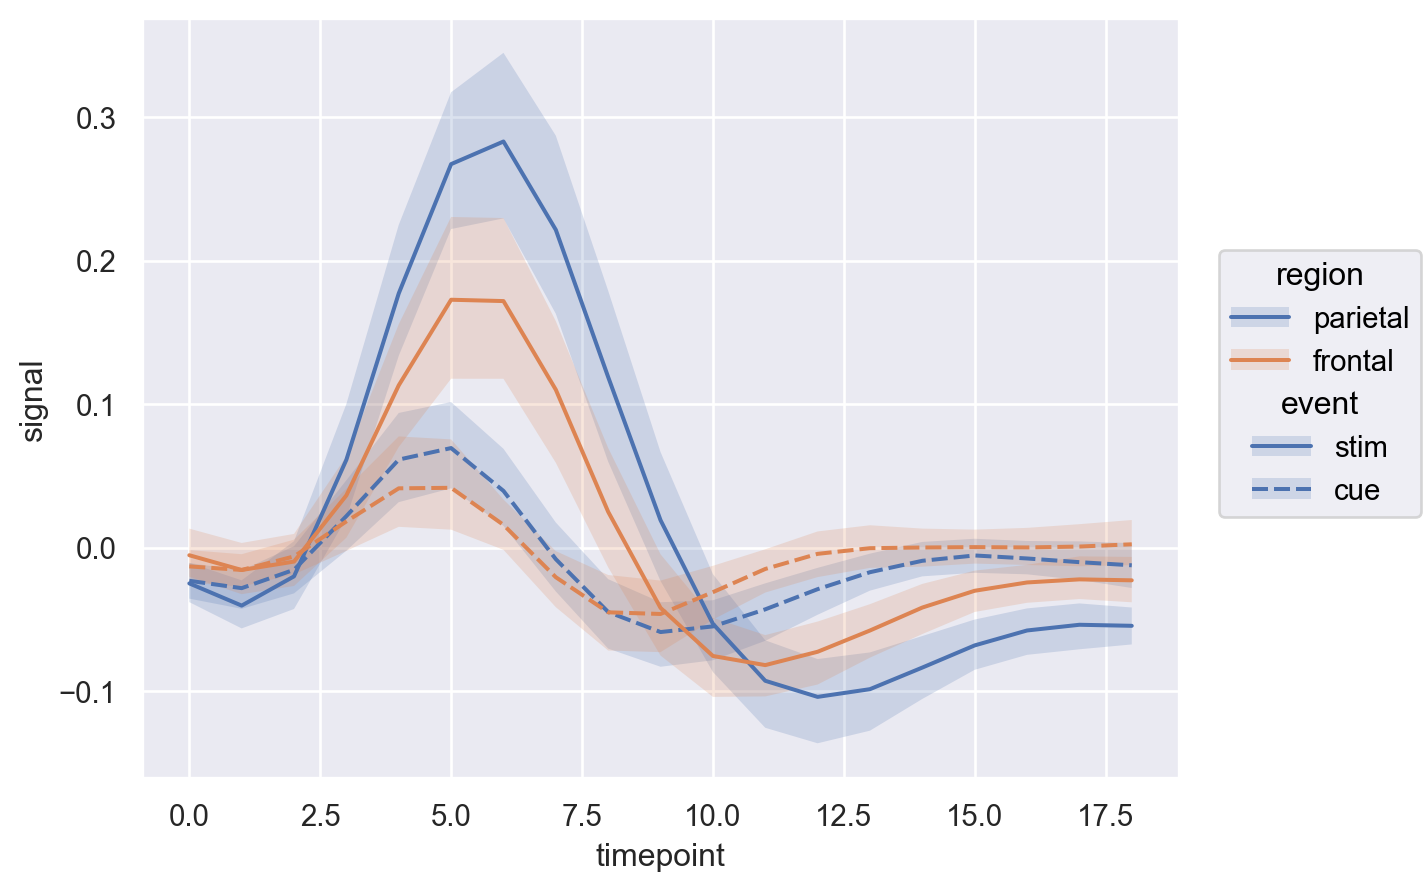
Combine with
Bandto show an error bar:( p .add(so.Line(), so.Agg()) .add(so.Band(), so.Est(), group="event") )
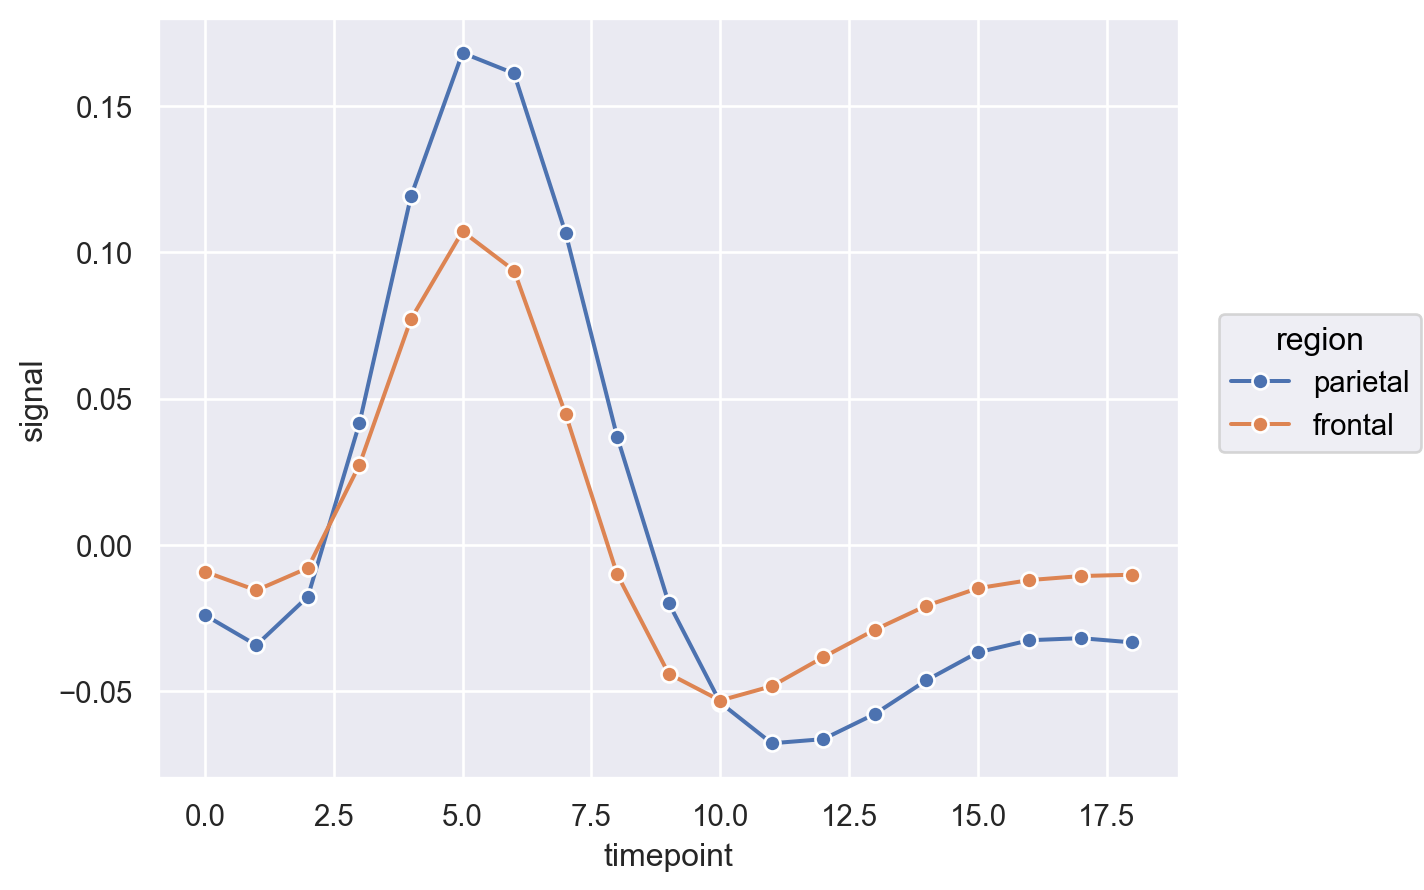
Add markers to indicate values where the data were sampled:
p.add(so.Line(marker="o", edgecolor="w"), so.Agg(), linestyle=None)