seaborn.objects.Plot.layout#
- Plot.layout(*, size=<default>, engine=<default>, extent=<default>)#
Control the figure size and layout.
Note
Default figure sizes and the API for specifying the figure size are subject to change in future “experimental” releases of the objects API. The default layout engine may also change.
- Parameters:
- size(width, height)
Size of the resulting figure, in inches. Size is inclusive of legend when using pyplot, but not otherwise.
- engine{{“tight”, “constrained”, “none”}}
Name of method for automatically adjusting the layout to remove overlap. The default depends on whether
Plot.on()is used.- extent(left, bottom, right, top)
Boundaries of the plot layout, in fractions of the figure size. Takes effect through the layout engine; exact results will vary across engines. Note: the extent includes axis decorations when using a layout engine, but it is exclusive of them when
engine="none".
Examples
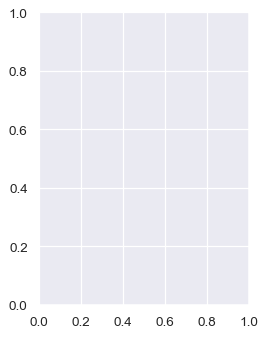
Control the overall dimensions of the figure with
size:p = so.Plot().layout(size=(4, 4)) p
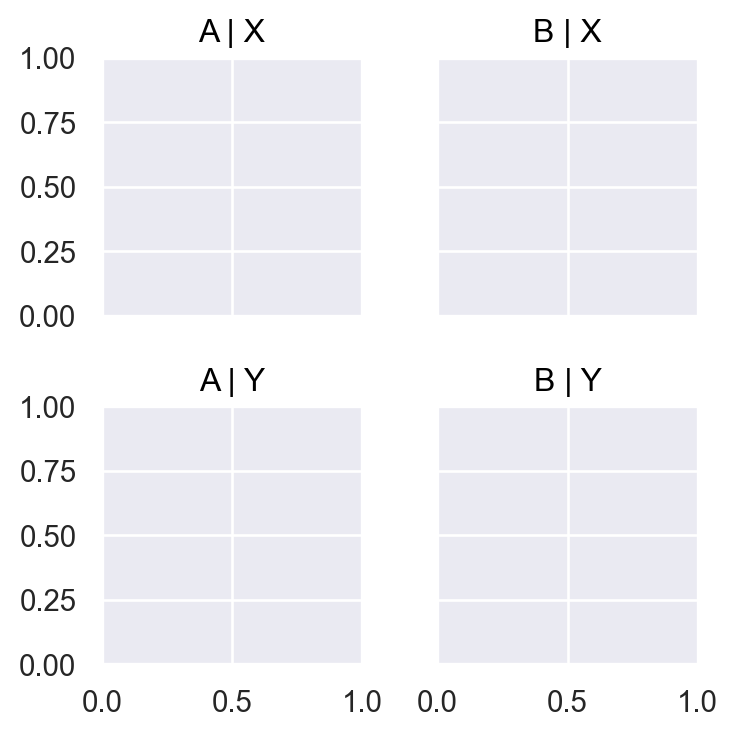
Subplots created by using
Plot.facet()orPlot.pair()will shrink to fit in the available space:p.facet(["A", "B"], ["X", "Y"])
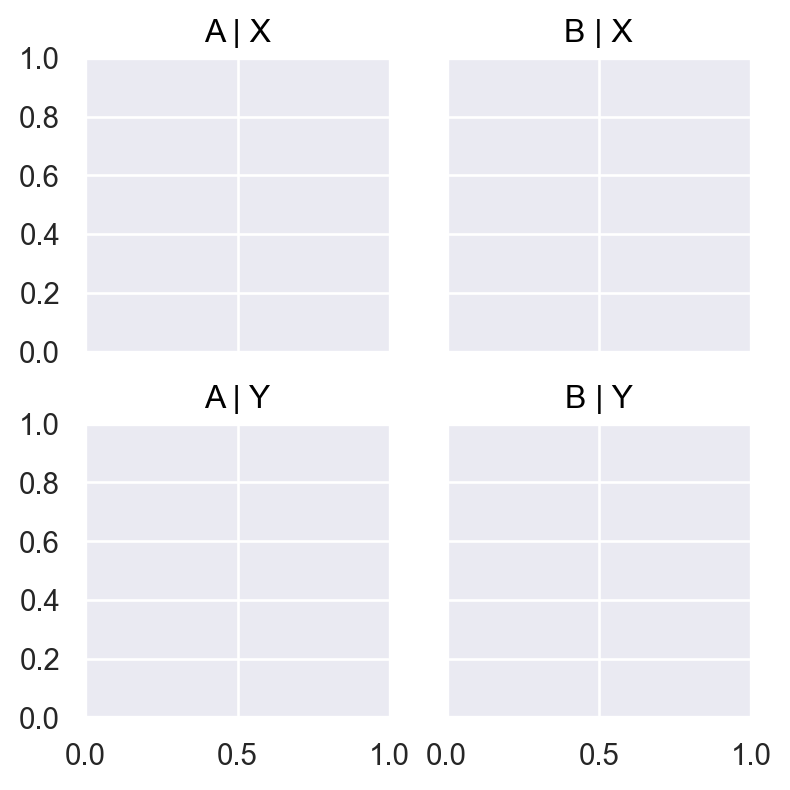
You may find that different automatic layout engines give better or worse results with specific plots:
p.facet(["A", "B"], ["X", "Y"]).layout(engine="constrained")
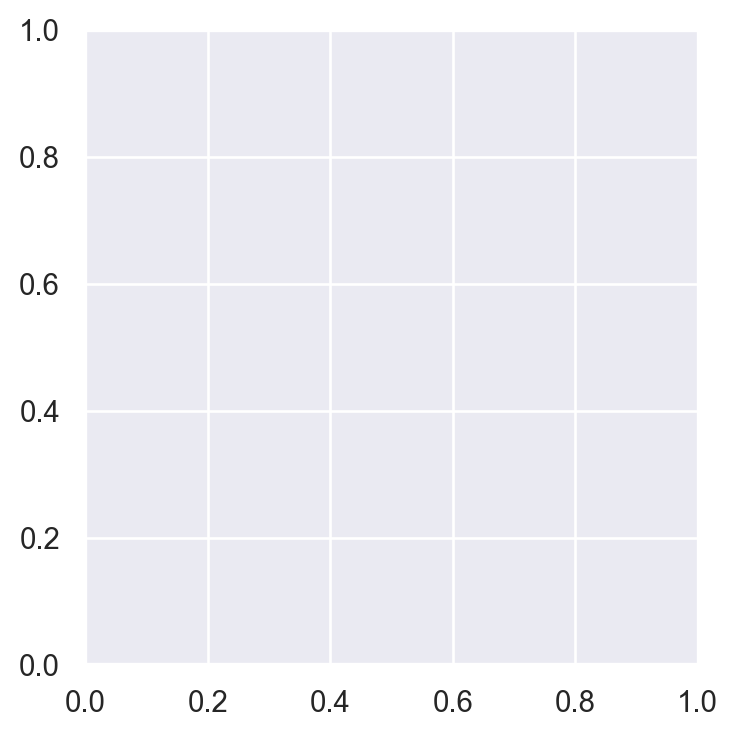
With
extent, you can control the size of the plot relative to the underlying figure. Because the notebook display adapts the figure background to the plot, this appears only to change the plot size in a notebook context. But it can be useful when saving or displaying through apyplotGUI window:p.layout(extent=[0, 0, .8, 1]).show()