seaborn.axes_style#
- seaborn.axes_style(style=None, rc=None)#
Get the parameters that control the general style of the plots.
The style parameters control properties like the color of the background and whether a grid is enabled by default. This is accomplished using the matplotlib rcParams system.
The options are illustrated in the aesthetics tutorial.
This function can also be used as a context manager to temporarily alter the global defaults. See
set_theme()orset_style()to modify the global defaults for all plots.- Parameters:
- styleNone, dict, or one of {darkgrid, whitegrid, dark, white, ticks}
A dictionary of parameters or the name of a preconfigured style.
- rcdict, optional
Parameter mappings to override the values in the preset seaborn style dictionaries. This only updates parameters that are considered part of the style definition.
Examples
Calling with no arguments will return the current defaults for the style parameters:
sns.axes_style()
{'axes.facecolor': 'white',
 'axes.edgecolor': 'black',
 'axes.grid': False,
 'axes.axisbelow': 'line',
 'axes.labelcolor': 'black',
 'figure.facecolor': 'white',
 'grid.color': '#b0b0b0',
 'grid.linestyle': '-',
 'text.color': 'black',
 'xtick.color': 'black',
 'ytick.color': 'black',
 'xtick.direction': 'out',
 'ytick.direction': 'out',
 'lines.solid_capstyle': <CapStyle.projecting: 'projecting'>,
 'patch.edgecolor': 'black',
 'patch.force_edgecolor': False,
 'image.cmap': 'viridis',
 'font.family': ['sans-serif'],
 'font.sans-serif': ['DejaVu Sans',
  'Bitstream Vera Sans',
  'Computer Modern Sans Serif',
  'Lucida Grande',
  'Verdana',
  'Geneva',
  'Lucid',
  'Arial',
  'Helvetica',
  'Avant Garde',
  'sans-serif'],
 'xtick.bottom': True,
 'xtick.top': False,
 'ytick.left': True,
 'ytick.right': False,
 'axes.spines.left': True,
 'axes.spines.bottom': True,
 'axes.spines.right': True,
 'axes.spines.top': True}
Calling with the name of a predefined style will show those parameter values:
sns.axes_style("darkgrid")
{'figure.facecolor': 'white',
 'axes.labelcolor': '.15',
 'xtick.direction': 'out',
 'ytick.direction': 'out',
 'xtick.color': '.15',
 'ytick.color': '.15',
 'axes.axisbelow': True,
 'grid.linestyle': '-',
 'text.color': '.15',
 'font.family': ['sans-serif'],
 'font.sans-serif': ['Arial',
  'DejaVu Sans',
  'Liberation Sans',
  'Bitstream Vera Sans',
  'sans-serif'],
 'lines.solid_capstyle': 'round',
 'patch.edgecolor': 'w',
 'patch.force_edgecolor': True,
 'image.cmap': 'rocket',
 'xtick.top': False,
 'ytick.right': False,
 'axes.grid': True,
 'axes.facecolor': '#EAEAF2',
 'axes.edgecolor': 'white',
 'grid.color': 'white',
 'axes.spines.left': True,
 'axes.spines.bottom': True,
 'axes.spines.right': True,
 'axes.spines.top': True,
 'xtick.bottom': False,
 'ytick.left': False}
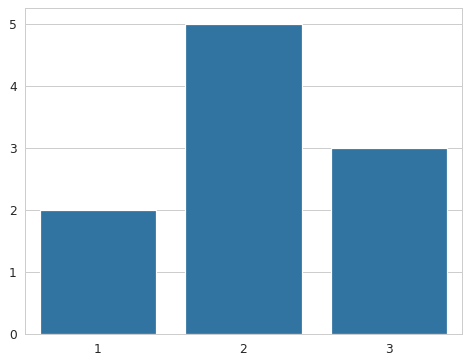
Use the function as a context manager to temporarily change the style of your plots:
with sns.axes_style("whitegrid"):
    sns.barplot(x=[1, 2, 3], y=[2, 5, 3])