seaborn.objects.Area#
- class seaborn.objects.Area(artist_kws=<factory>, color=<'C0'>, alpha=<0.2>, fill=<True>, edgecolor=<depend:color>, edgealpha=<1>, edgewidth=<rc:patch.linewidth>, edgestyle=<'-'>, baseline=<0>)#
A fill mark drawn from a baseline to data values.
- This mark defines the following properties:
color, alpha, fill, edgecolor, edgealpha, edgewidth, edgestyle, |baseline|
See also
BandA fill mark representing an interval between values.
Examples
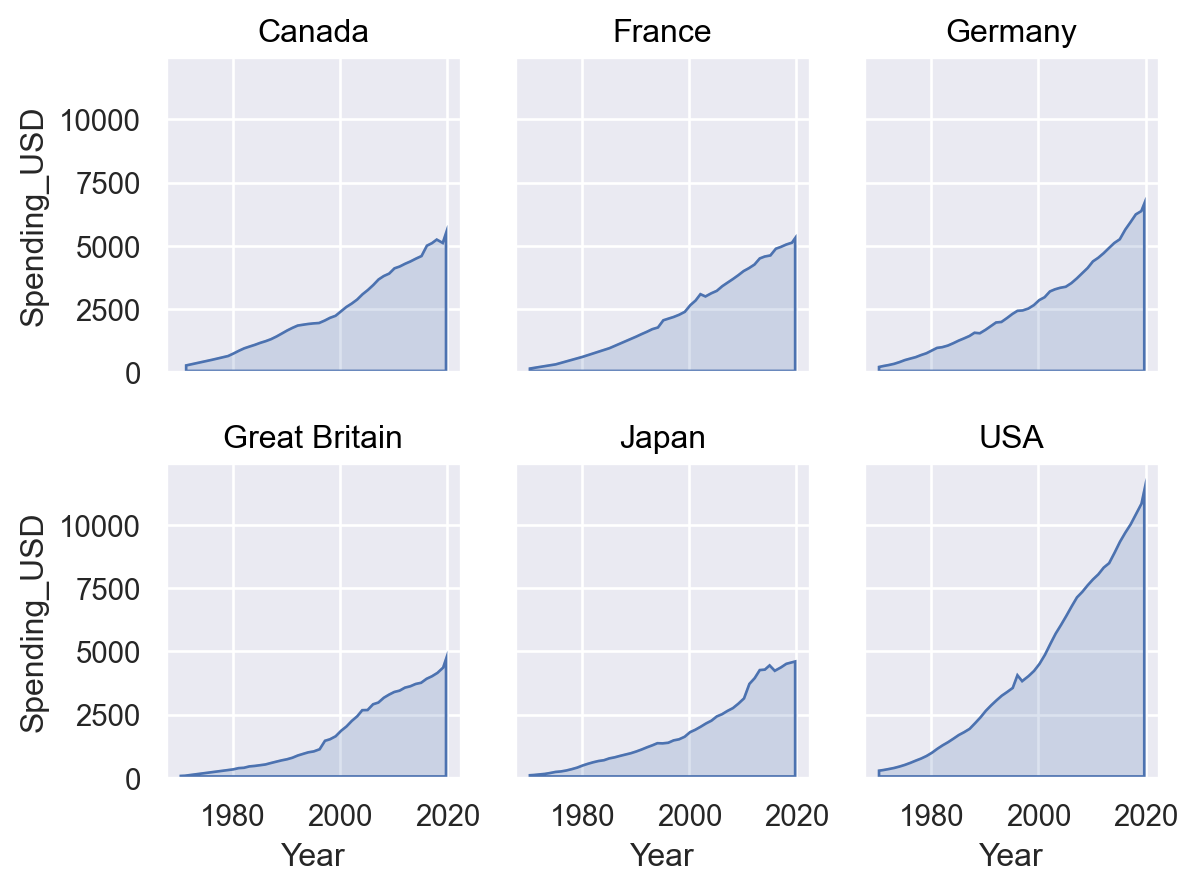
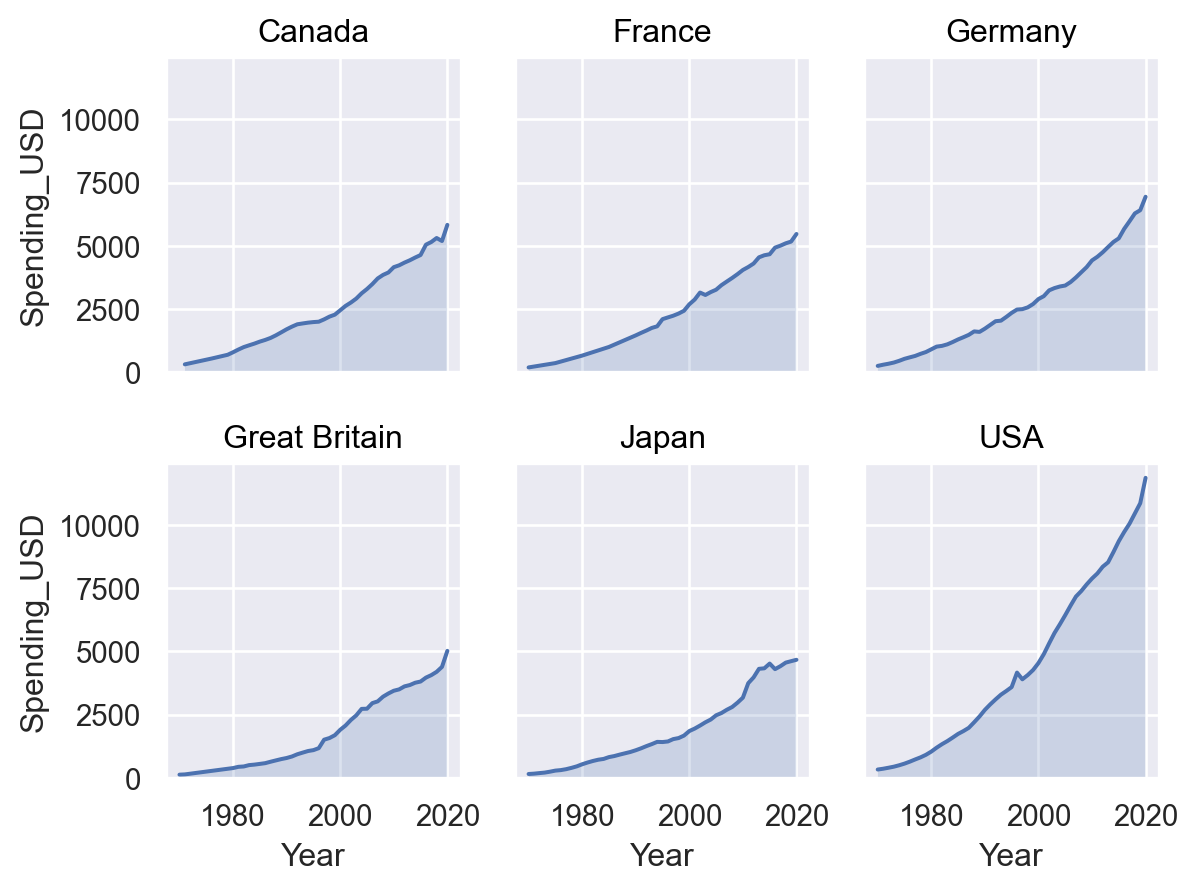
p = so.Plot(healthexp, "Year", "Spending_USD").facet("Country", wrap=3)
p.add(so.Area())
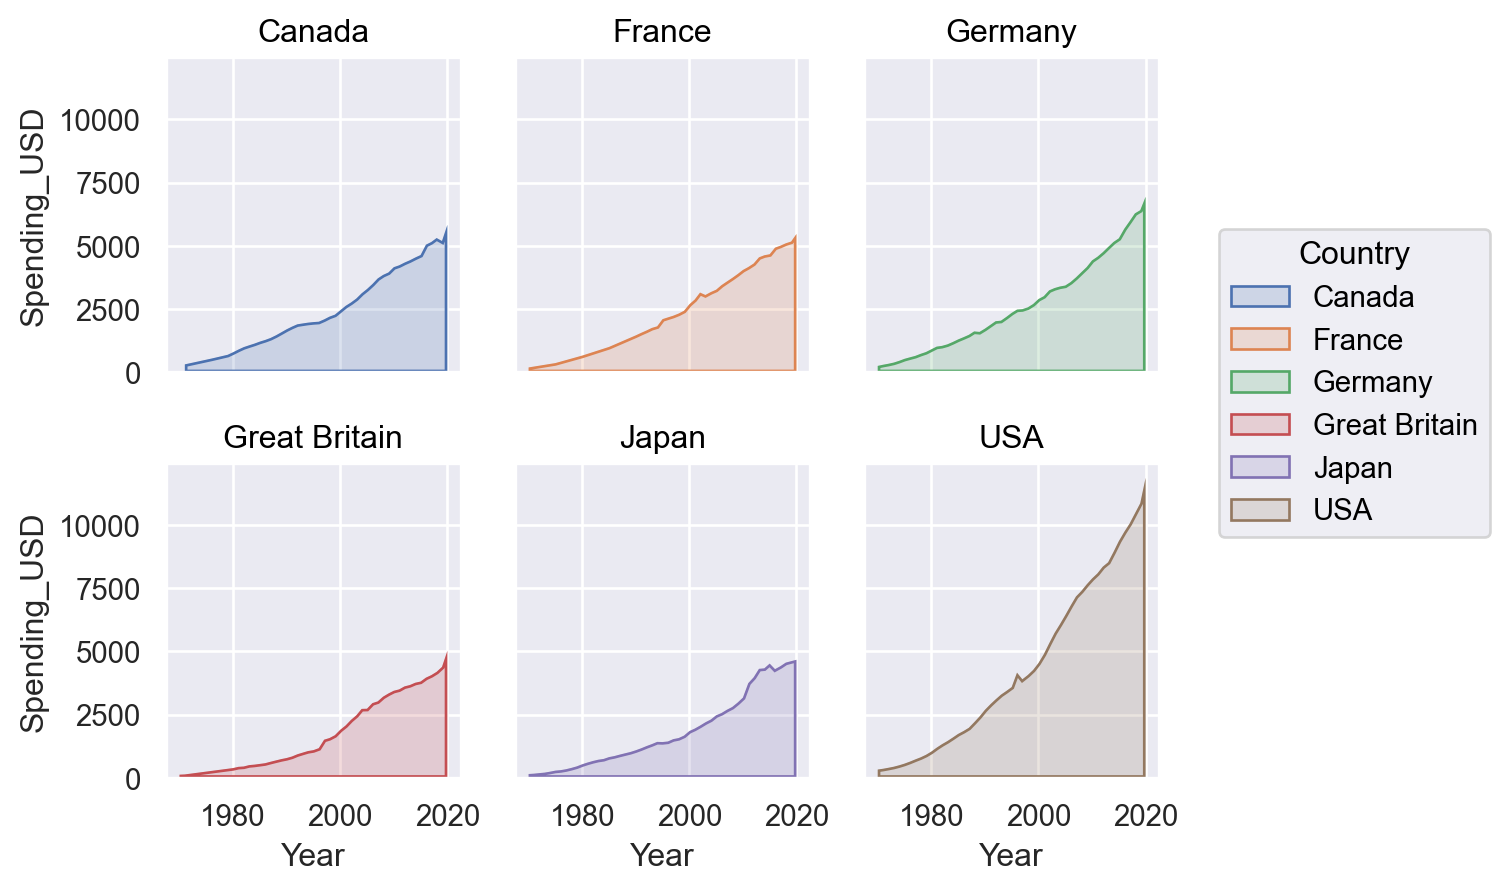
The
colorproperty sets both the edge and fill color:p.add(so.Area(), color="Country")
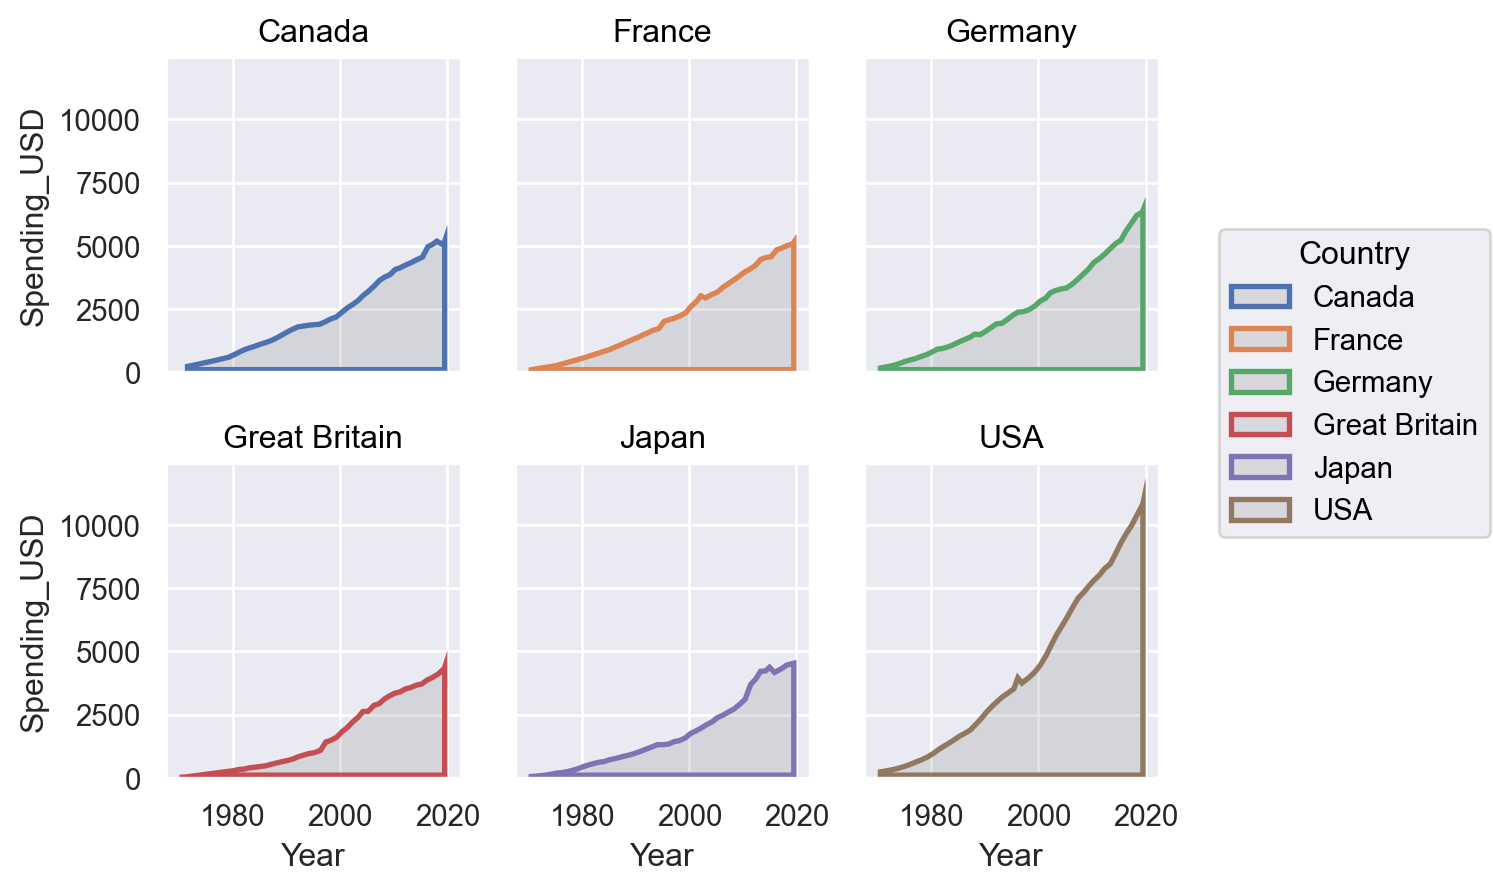
It’s also possible to map only the
edgecolor:p.add(so.Area(color=".5", edgewidth=2), edgecolor="Country")
The mark is drawn as a polygon, but it can be combined with
Lineto draw a shaded region by settingedgewidth=0:p.add(so.Area(edgewidth=0)).add(so.Line())
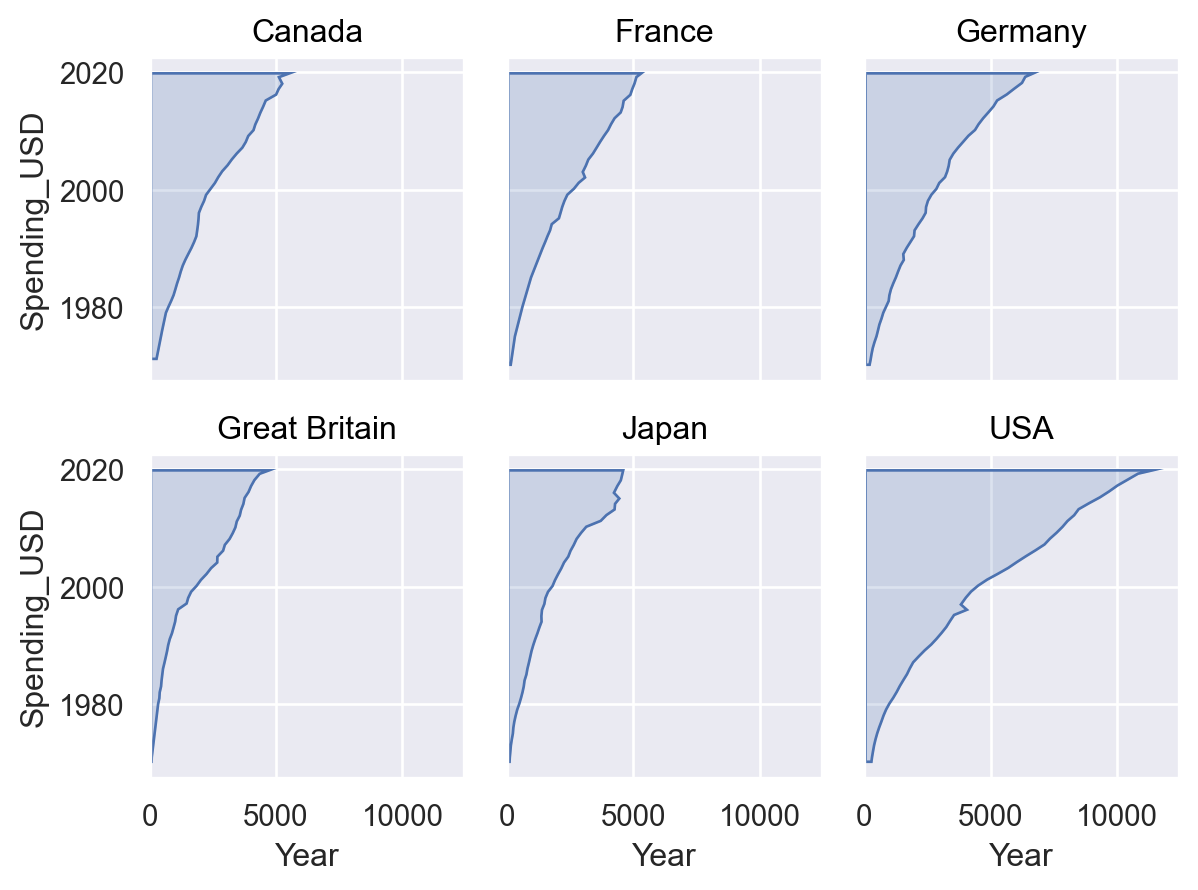
The layer’s orientation defines the axis that the mark fills from:
p.add(so.Area(), x="Spending_USD", y="Year", orient="y")
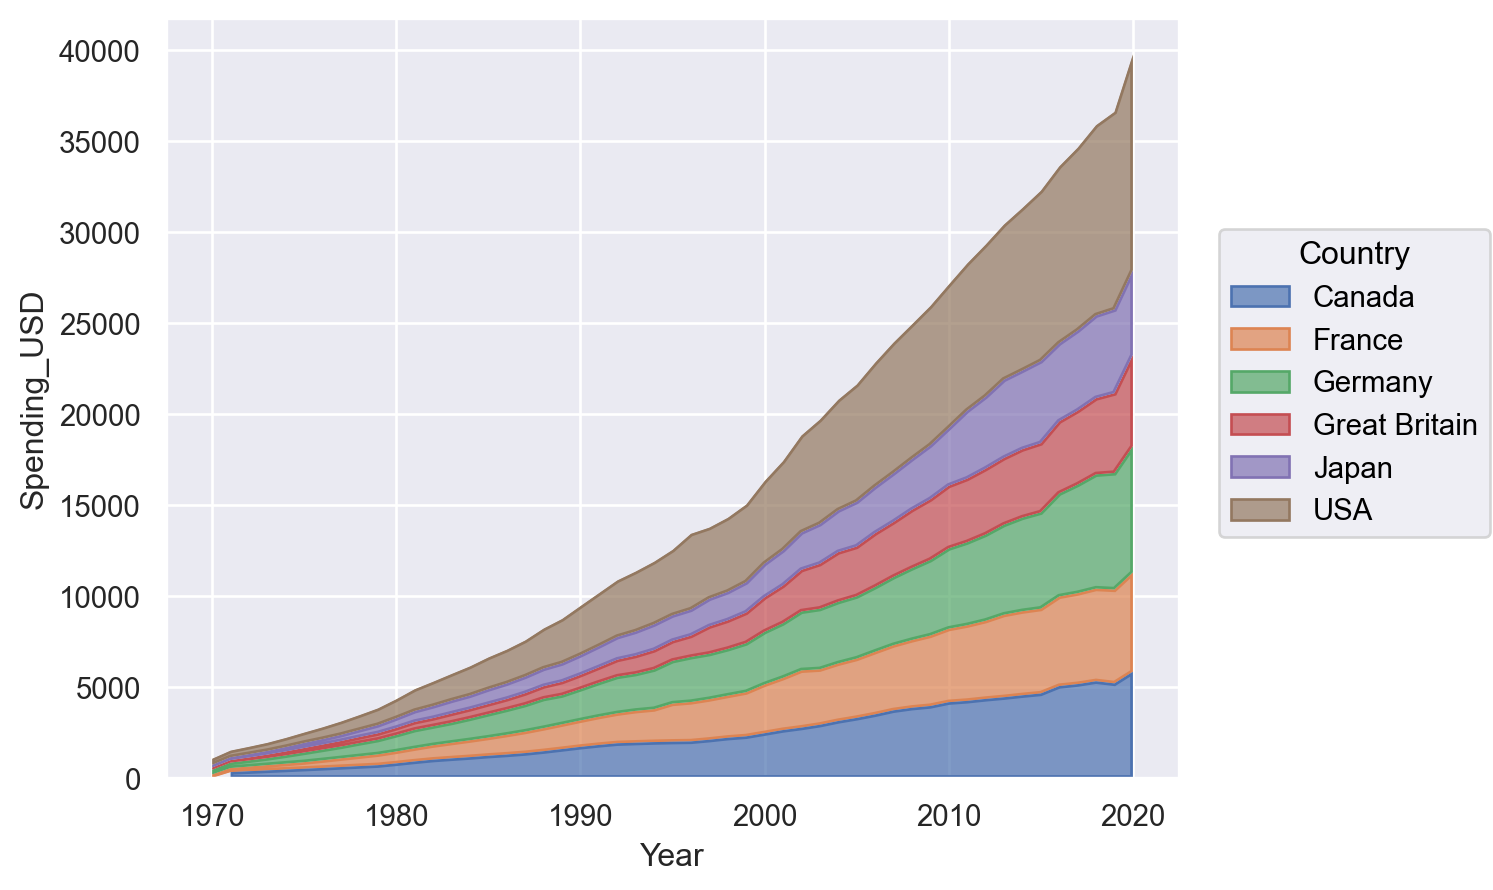
This mark can be stacked to show part-whole relationships:
(
    so.Plot(healthexp, "Year", "Spending_USD", color="Country")
    .add(so.Area(alpha=.7), so.Stack())
)