seaborn.objects.Bar#
- class seaborn.objects.Bar(artist_kws=<factory>, color=<'C0'>, alpha=<0.7>, fill=<True>, edgecolor=<depend:color>, edgealpha=<1>, edgewidth=<rc:patch.linewidth>, edgestyle=<'-'>, width=<0.8>, baseline=<0>)#
A bar mark drawn between baseline and data values.
- This mark defines the following properties:
color, alpha, fill, edgecolor, edgealpha, edgewidth, edgestyle, |width|, |baseline|
See also
BarsA faster bar mark with defaults more suitable for histograms.
Examples
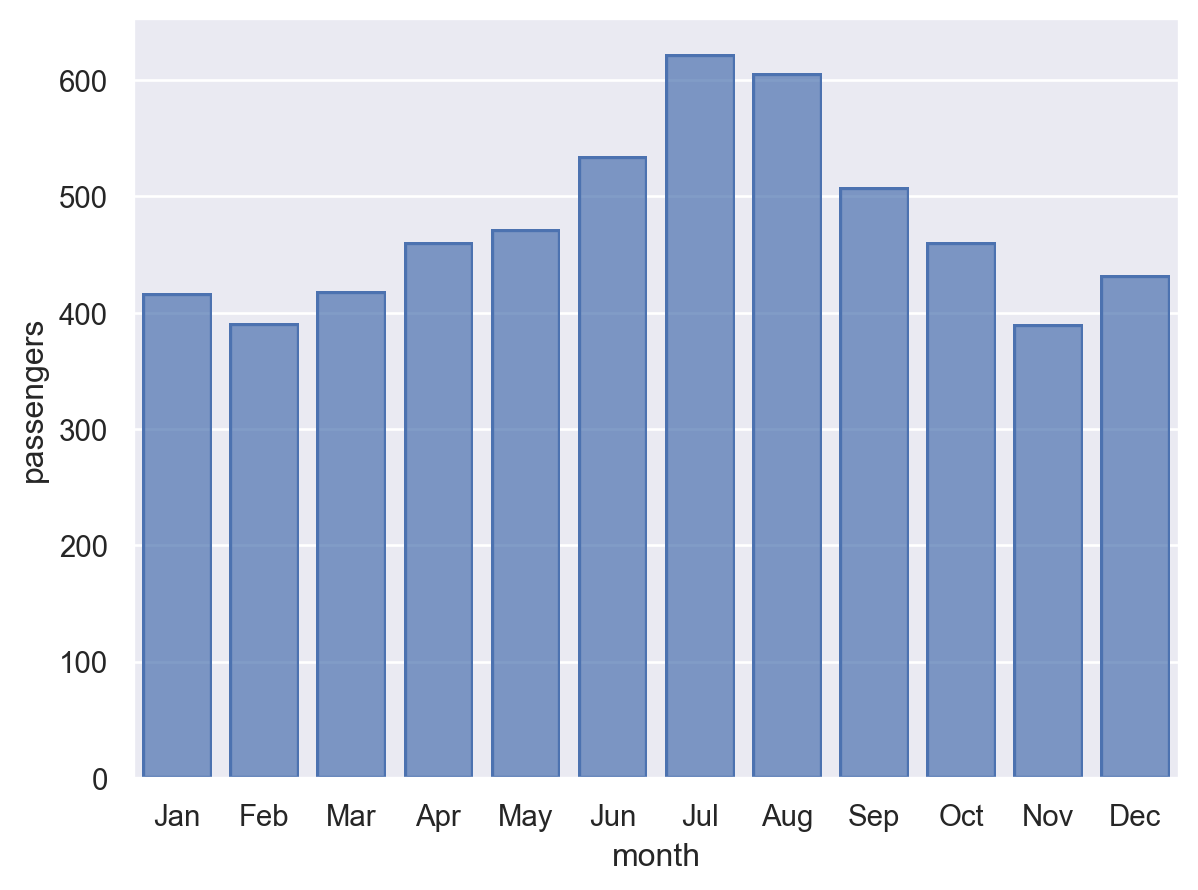
The mark draws discrete bars from a baseline to provided values:
so.Plot(flights["month"], flights["passengers"]).add(so.Bar())
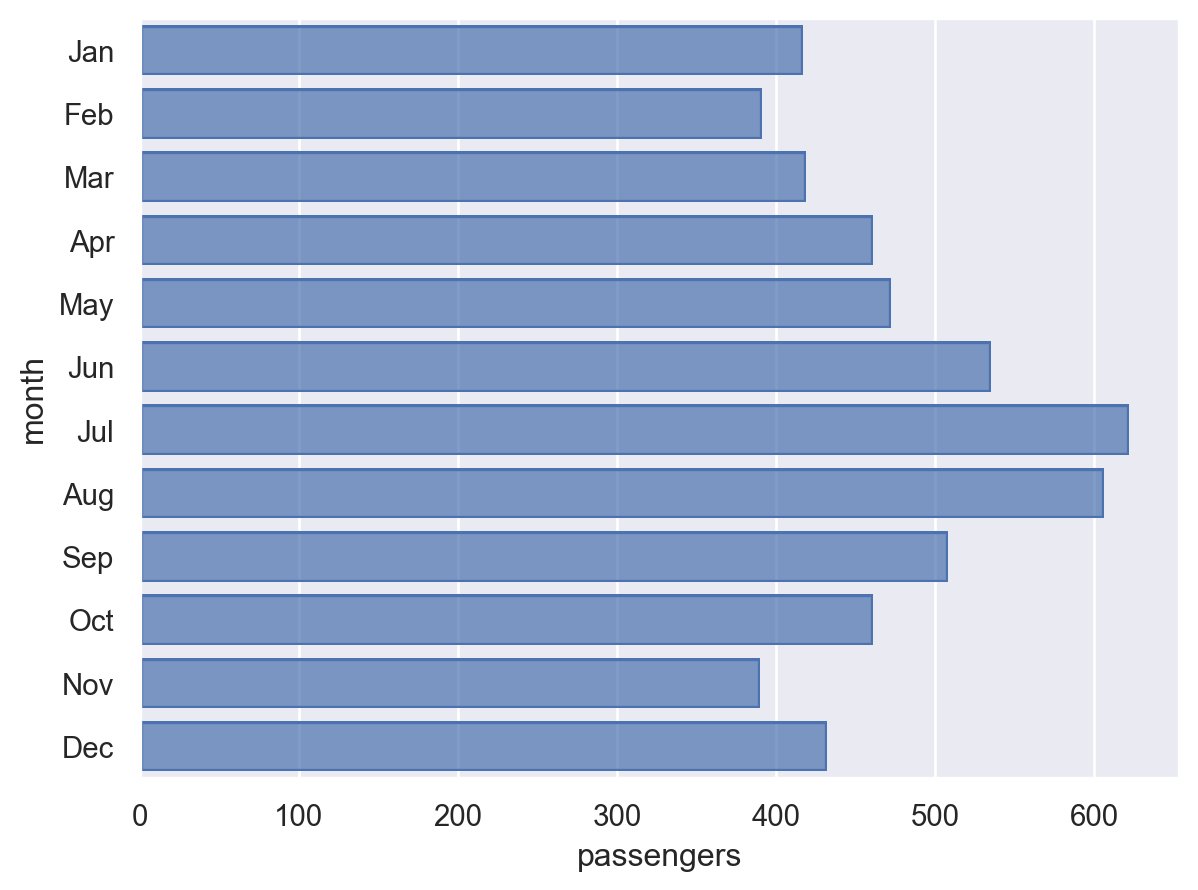
The bars are oriented depending on the x/y variable types and the
orientparameter:so.Plot(flights["passengers"], flights["month"]).add(so.Bar())
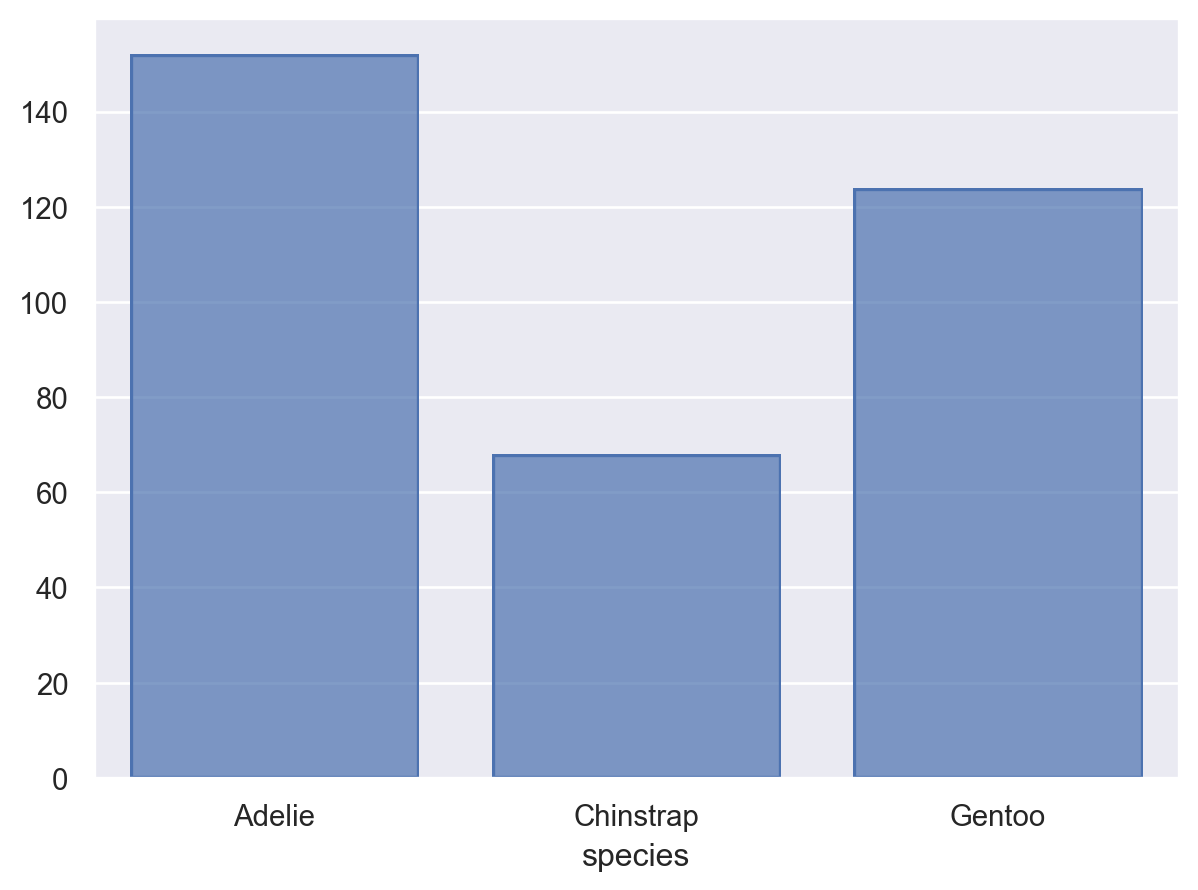
A common usecase will be drawing histograms on a variable with a nominal scale:
so.Plot(penguins, x="species").add(so.Bar(), so.Hist())
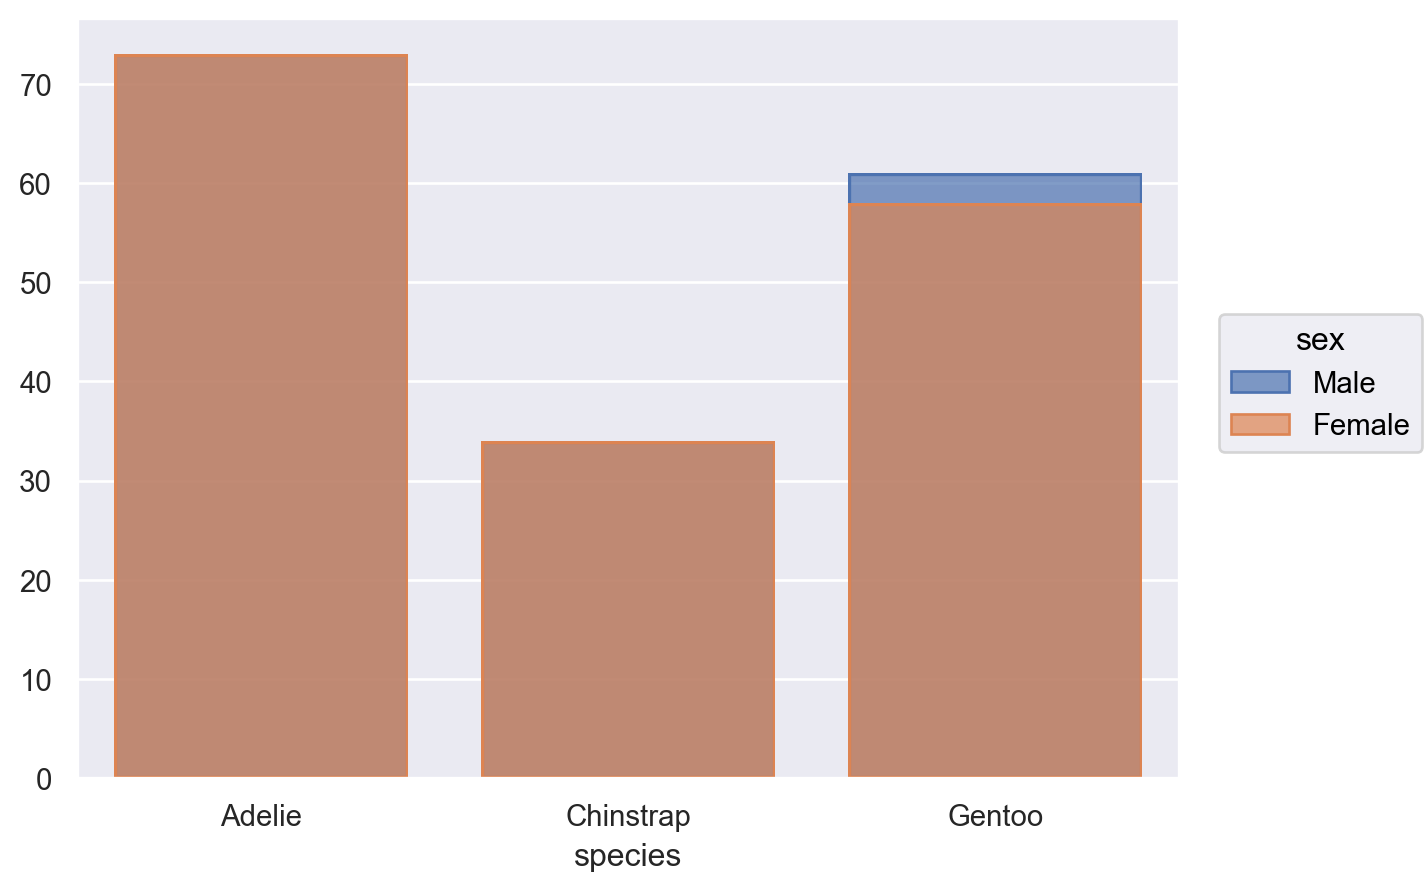
When mapping additional variables, the bars will overlap by default:
so.Plot(penguins, x="species", color="sex").add(so.Bar(), so.Hist())
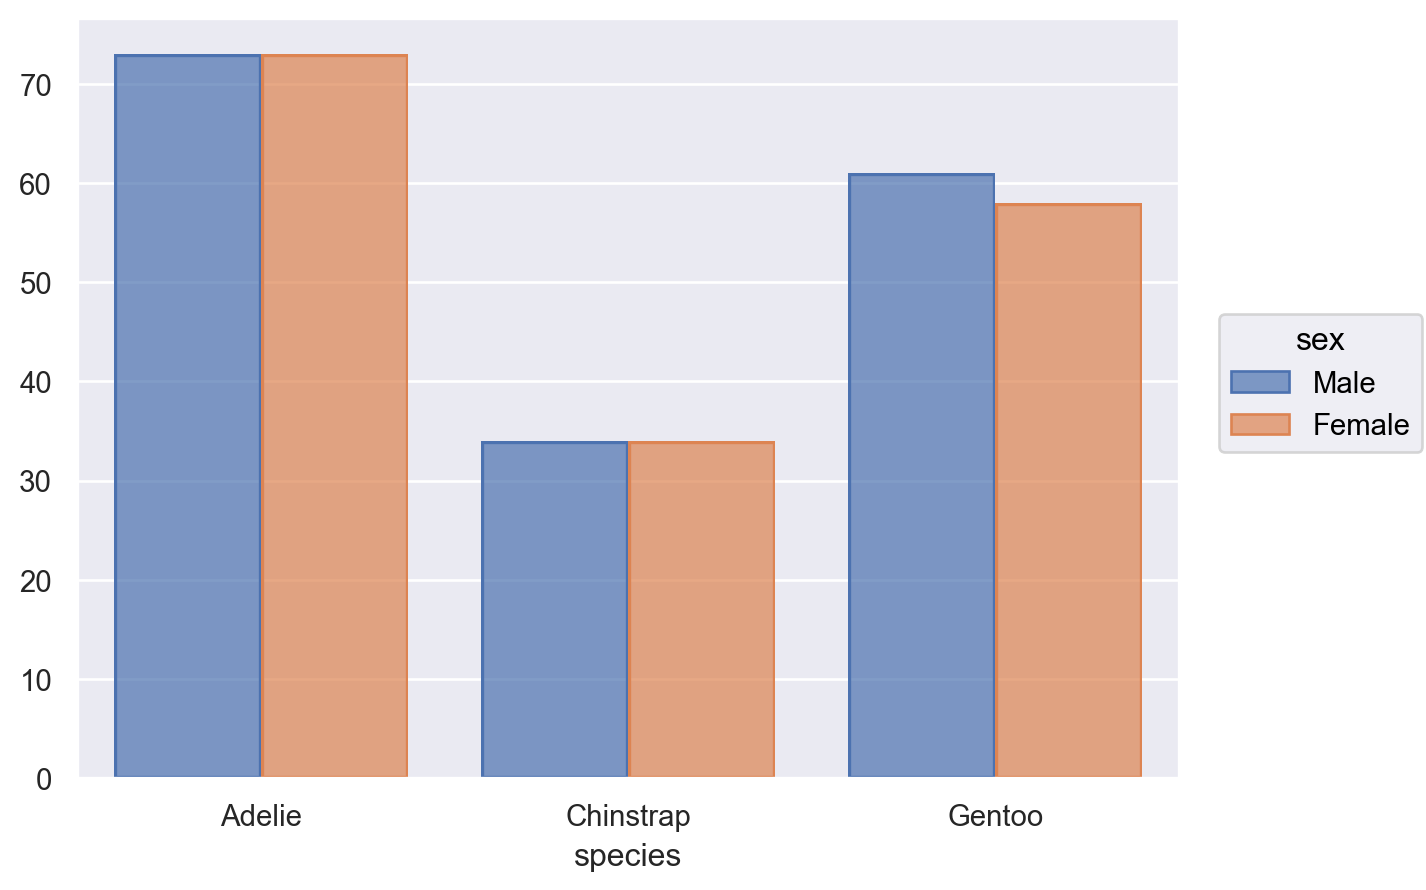
Apply a move transform, such as a
DodgeorStackto resolve them:so.Plot(penguins, x="species", color="sex").add(so.Bar(), so.Hist(), so.Dodge())
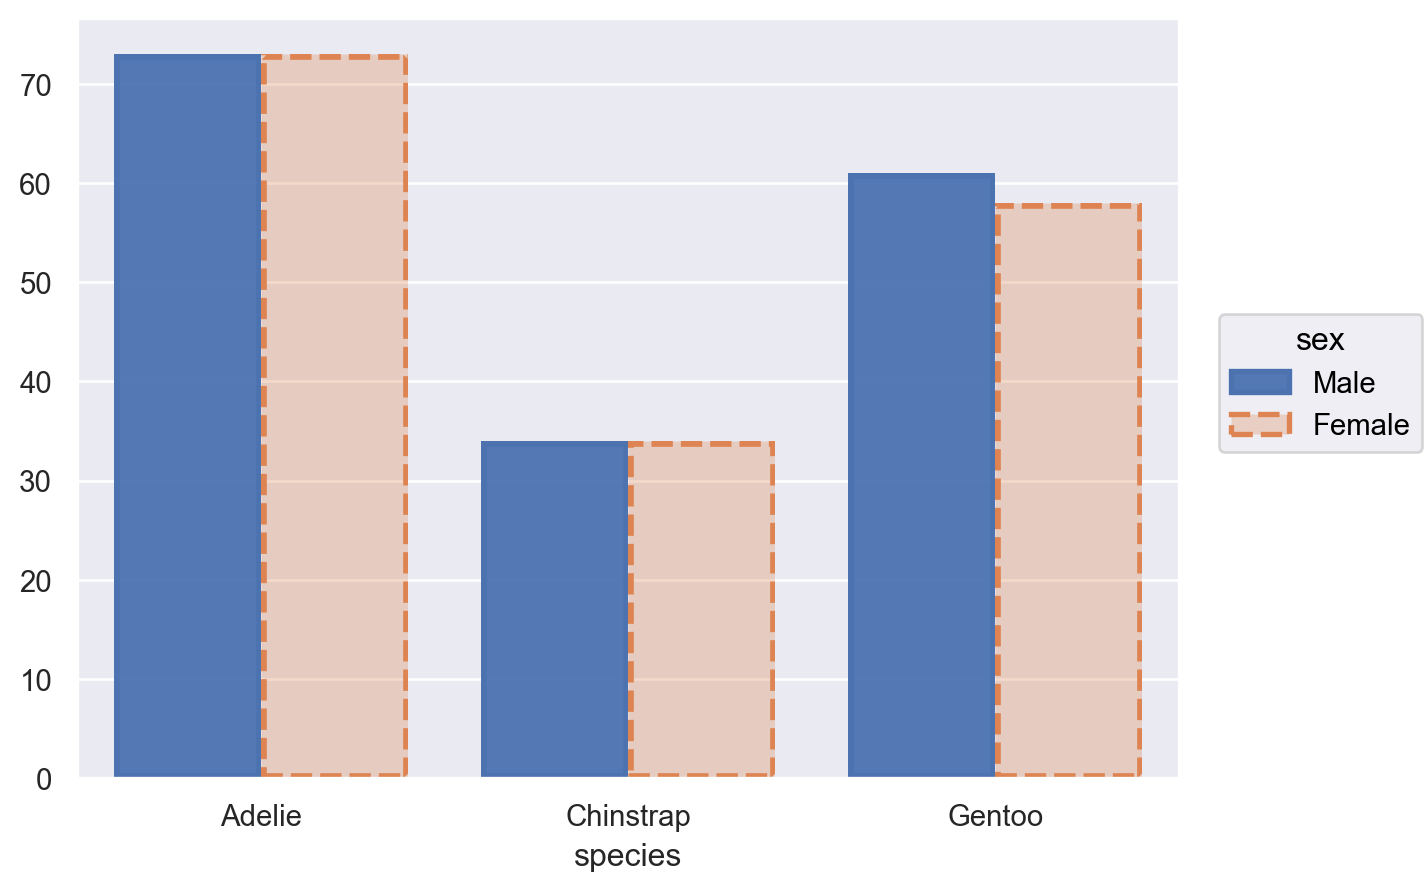
A number of properties can be mapped or set:
(
    so.Plot(
        penguins, x="species",
        color="sex", alpha="sex", edgestyle="sex",
    )
    .add(so.Bar(edgewidth=2), so.Hist(), so.Dodge("fill"))
)
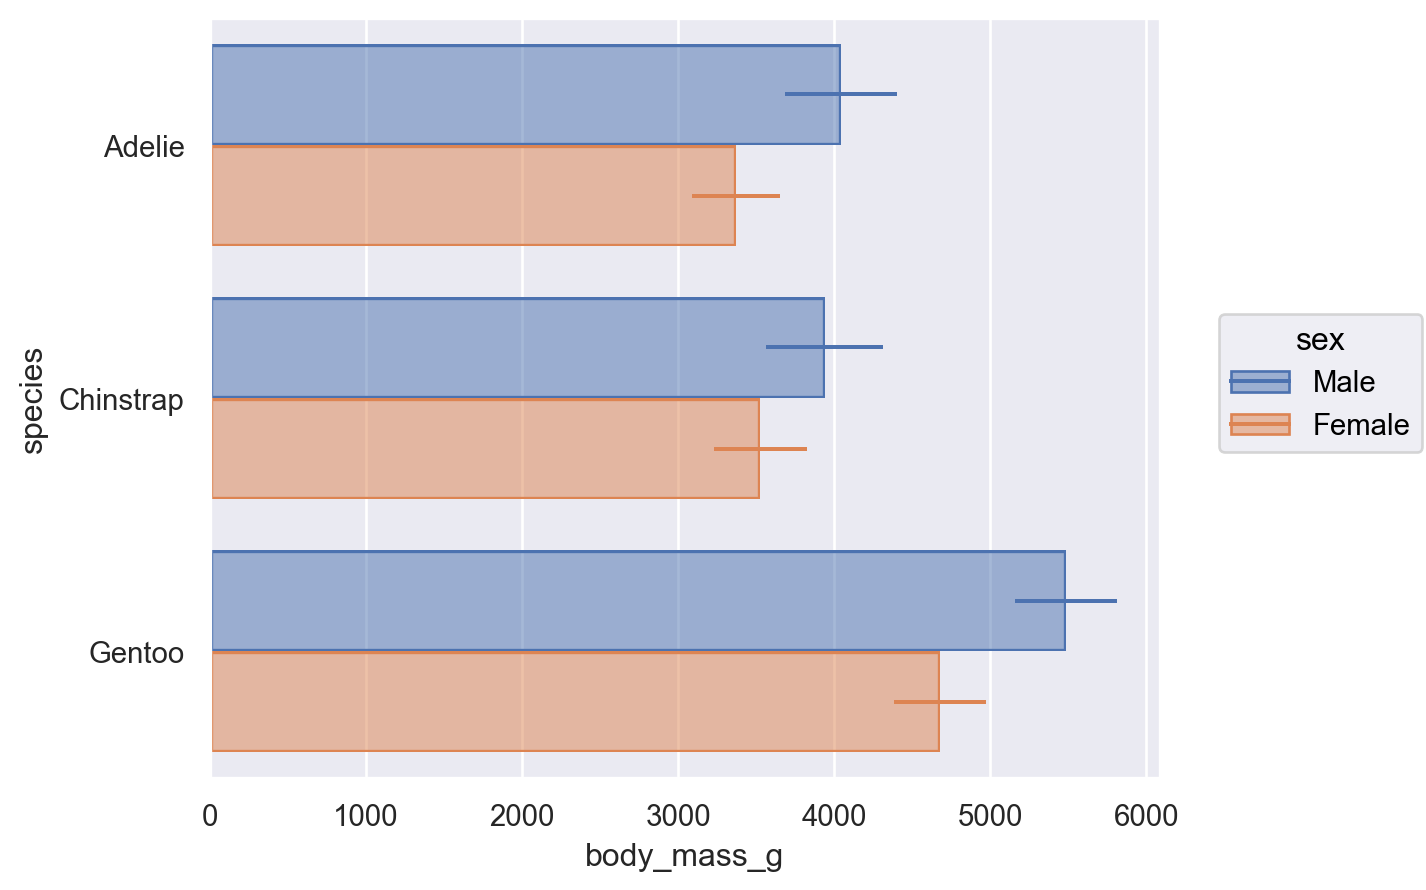
Combine with
Rangeto plot an estimate with errorbars:( so.Plot(penguins, "body_mass_g", "species", color="sex") .add(so.Bar(alpha=.5), so.Agg(), so.Dodge()) .add(so.Range(), so.Est(errorbar="sd"), so.Dodge()) )