seaborn.objects.Plot.pair#
- Plot.pair(x=None, y=None, wrap=None, cross=True)#
Produce subplots by pairing multiple
xand/oryvariables.- Parameters:
- x, ysequence(s) of data vectors or identifiers
Variables that will define the grid of subplots.
- wrapint
When using only
xory, “wrap” subplots across a two-dimensional grid with this many columns (when usingx) or rows (when usingy).- crossbool
When False, zip the
xandylists such that the first subplot gets the first pair, the second gets the second pair, etc. Otherwise, create a two-dimensional grid from the cartesian product of the lists.
Examples
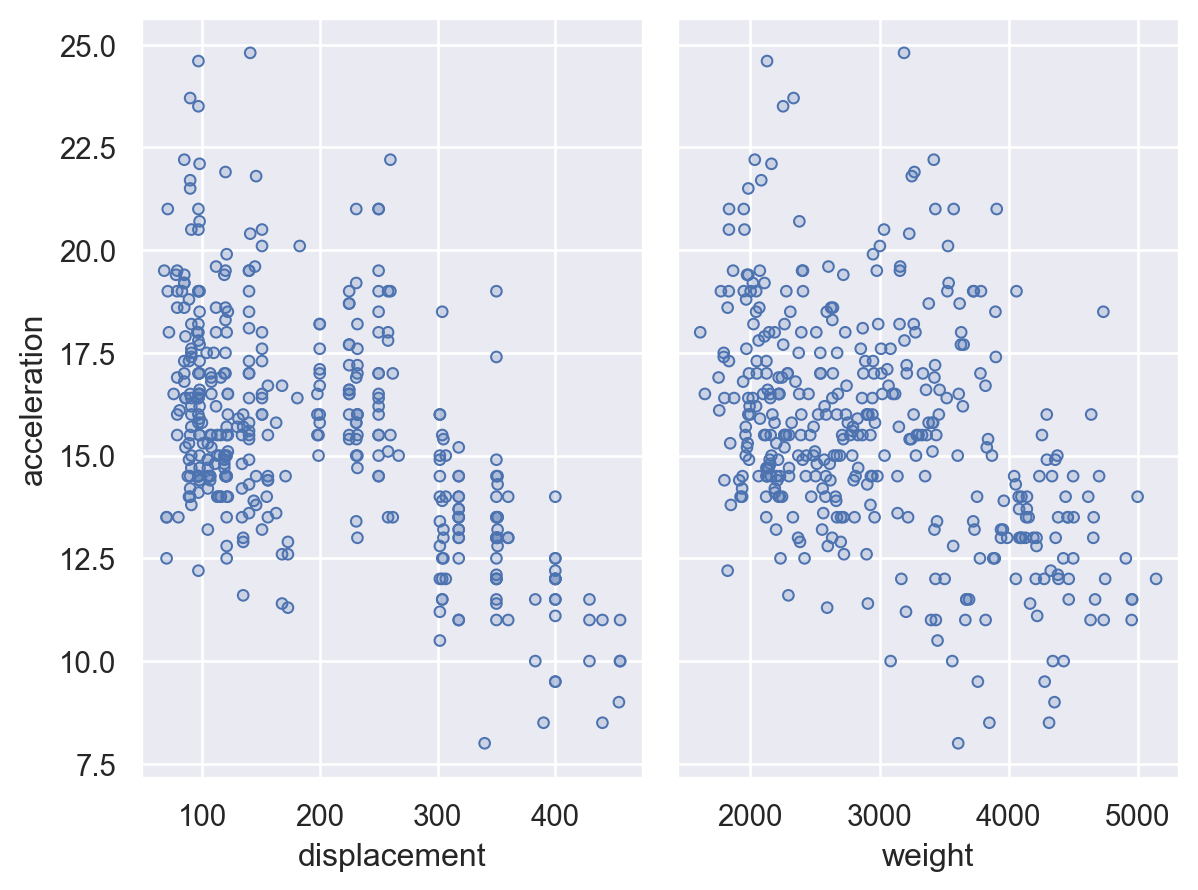
Plot one dependent variable against multiple independent variables by assigning
yand pairing onx:( so.Plot(mpg, y="acceleration") .pair(x=["displacement", "weight"]) .add(so.Dots()) )
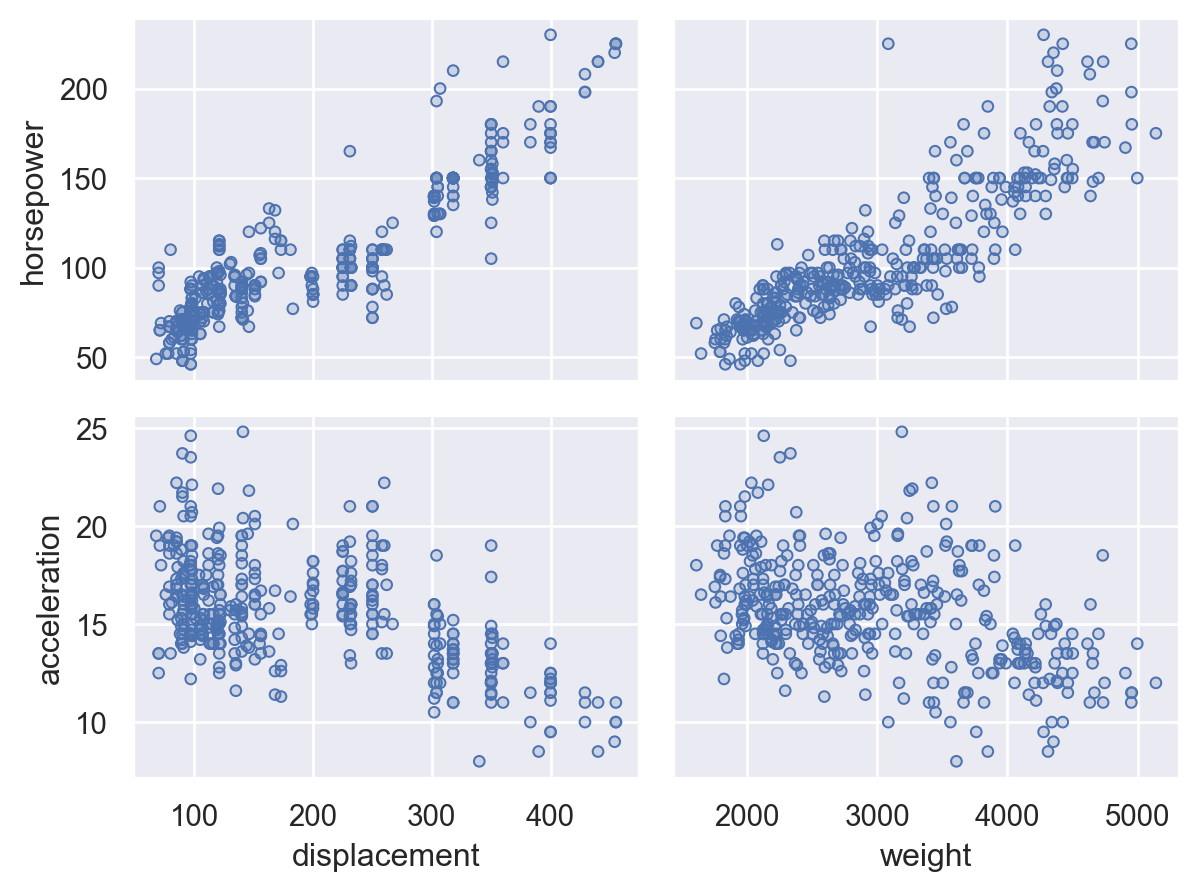
Show multiple pairwise relationships by passing lists to both
xandy:( so.Plot(mpg) .pair(x=["displacement", "weight"], y=["horsepower", "acceleration"]) .add(so.Dots()) )
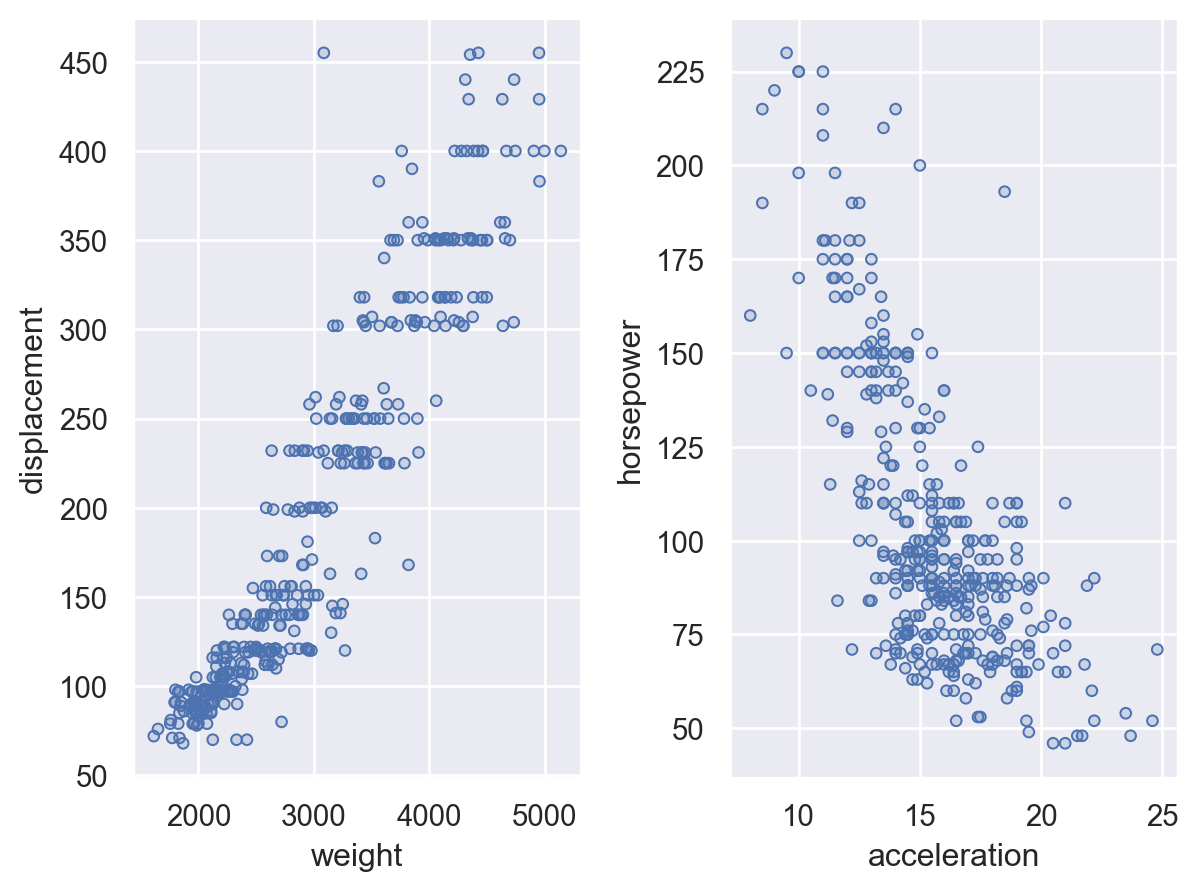
When providing lists for both
xandy, passcross=Falseto pair each position in the list rather than showing all pairwise relationships:( so.Plot(mpg) .pair( x=["weight", "acceleration"], y=["displacement", "horsepower"], cross=False, ) .add(so.Dots()) )
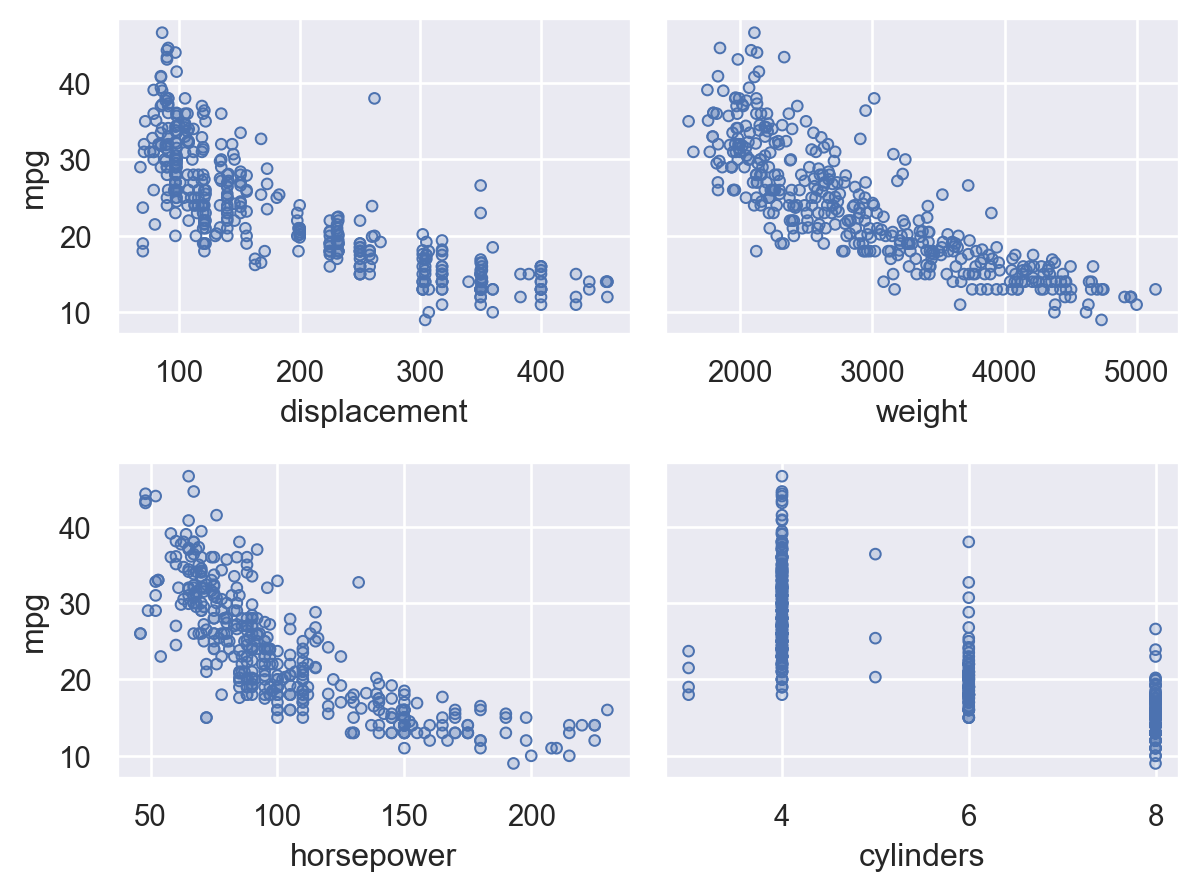
When plotting against several
xoryvariables, it is possible towrapthe subplots to produce a two-dimensional grid:( so.Plot(mpg, y="mpg") .pair(x=["displacement", "weight", "horsepower", "cylinders"], wrap=2) .add(so.Dots()) )
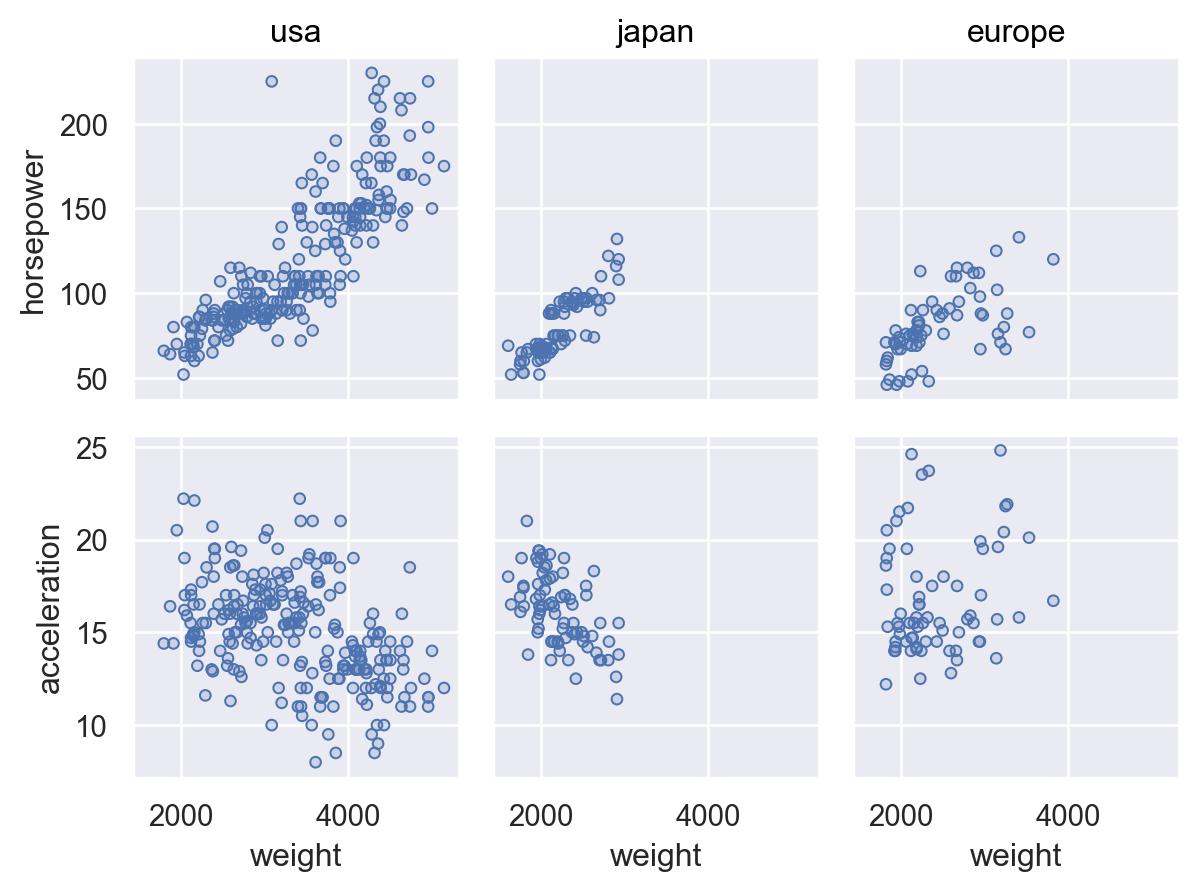
Pairing can be combined with faceting, either pairing on
yand faceting oncolor pairing onxand faceting onrow:( so.Plot(mpg, x="weight") .pair(y=["horsepower", "acceleration"]) .facet(col="origin") .add(so.Dots()) )
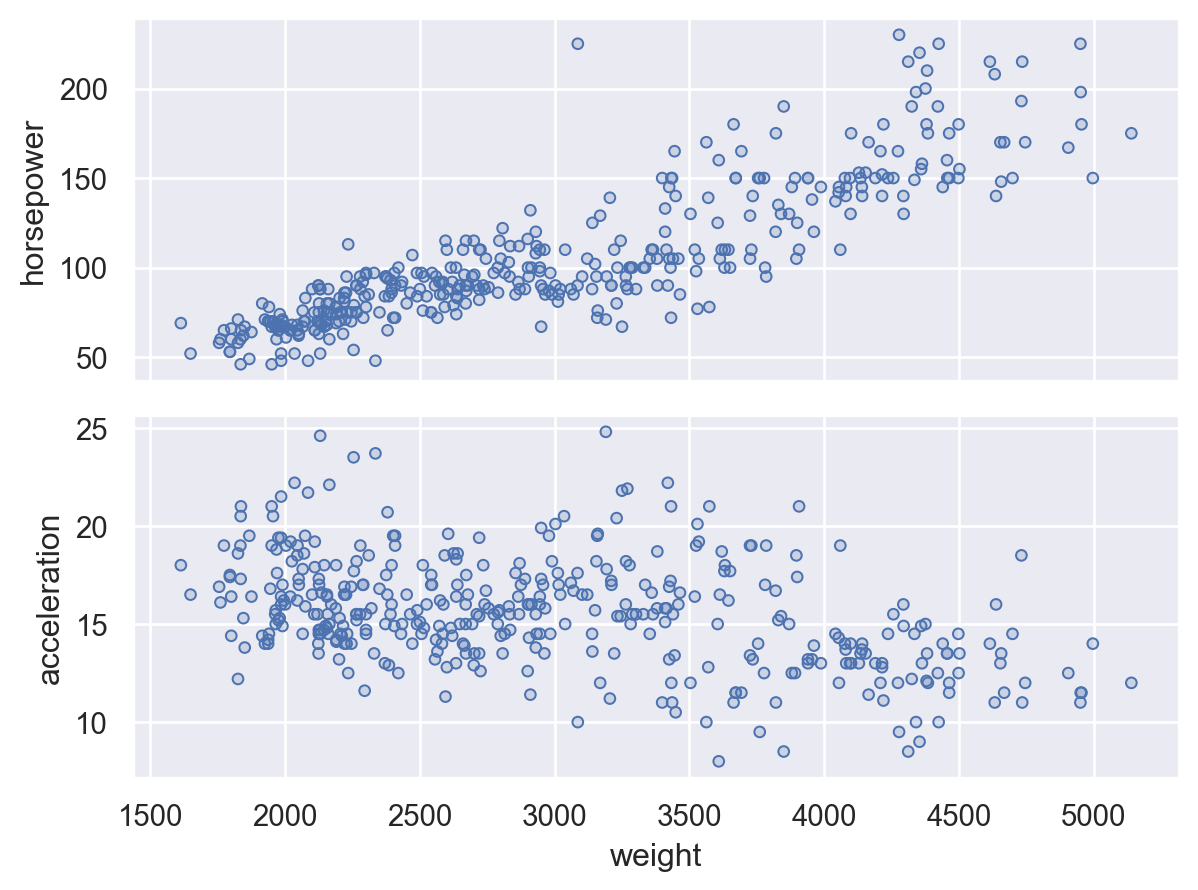
While typically convenient to assign pairing variables as references to the common
data, it’s also possible to pass a list of vectors:( so.Plot(mpg["weight"]) .pair(y=[mpg["horsepower"], mpg["acceleration"]]) .add(so.Dots()) )
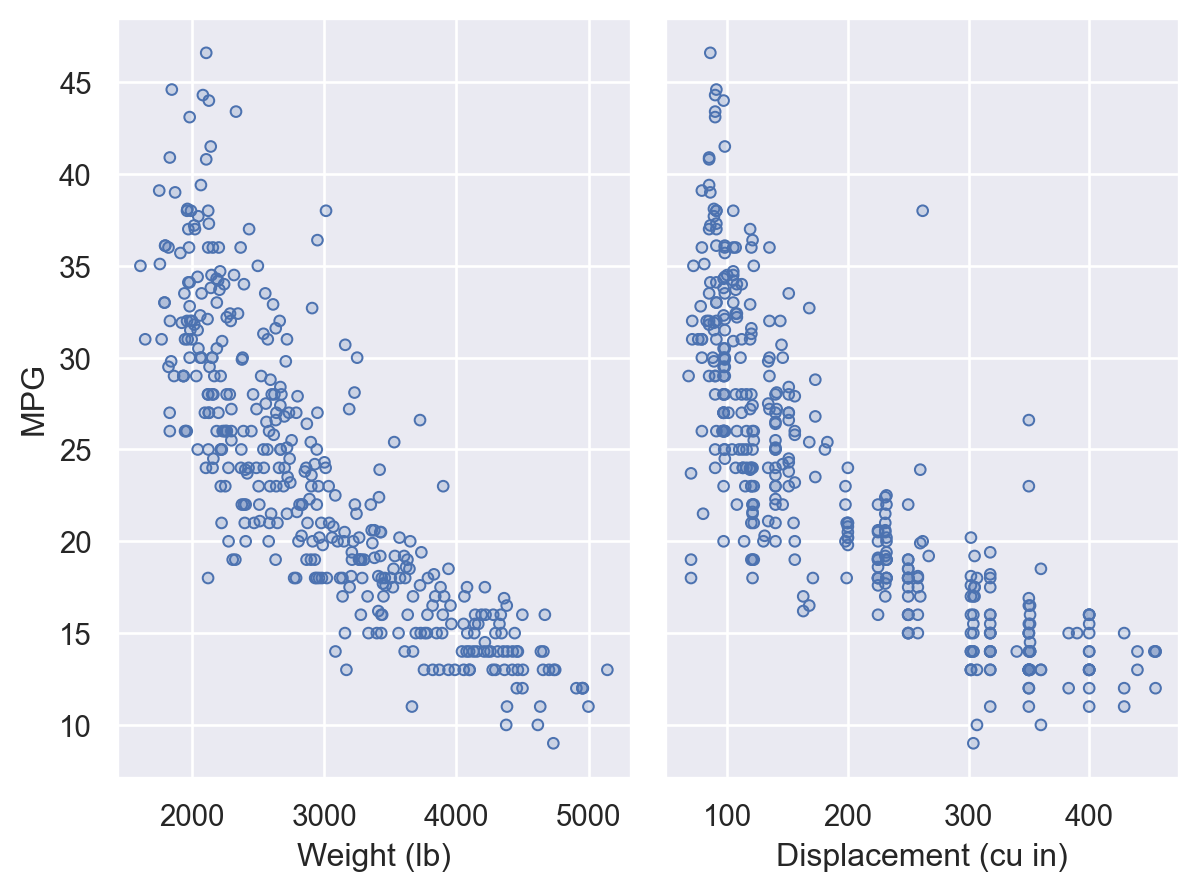
When customizing the plot through methods like
Plot.label(),Plot.limit(), orPlot.scale(), you can refer to the individual coordinate variables asx0,x1, etc.:( so.Plot(mpg, y="mpg") .pair(x=["weight", "displacement"]) .label(x0="Weight (lb)", x1="Displacement (cu in)", y="MPG") .add(so.Dots()) )