seaborn.objects.Est#
- class seaborn.objects.Est(func='mean', errorbar=('ci', 95), n_boot=1000, seed=None)#
Calculate a point estimate and error bar interval.
For additional information about the various
errorbarchoices, see the errorbar tutorial.- Parameters:
- funcstr or callable
Name of a
numpy.ndarraymethod or a vector -> scalar function.- errorbarstr, (str, float) tuple, or callable
Name of errorbar method (one of “ci”, “pi”, “se” or “sd”), or a tuple with a method name ane a level parameter, or a function that maps from a vector to a (min, max) interval.
- n_bootint
Number of bootstrap samples to draw for “ci” errorbars.
- seedint
Seed for the PRNG used to draw bootstrap samples.
Examples
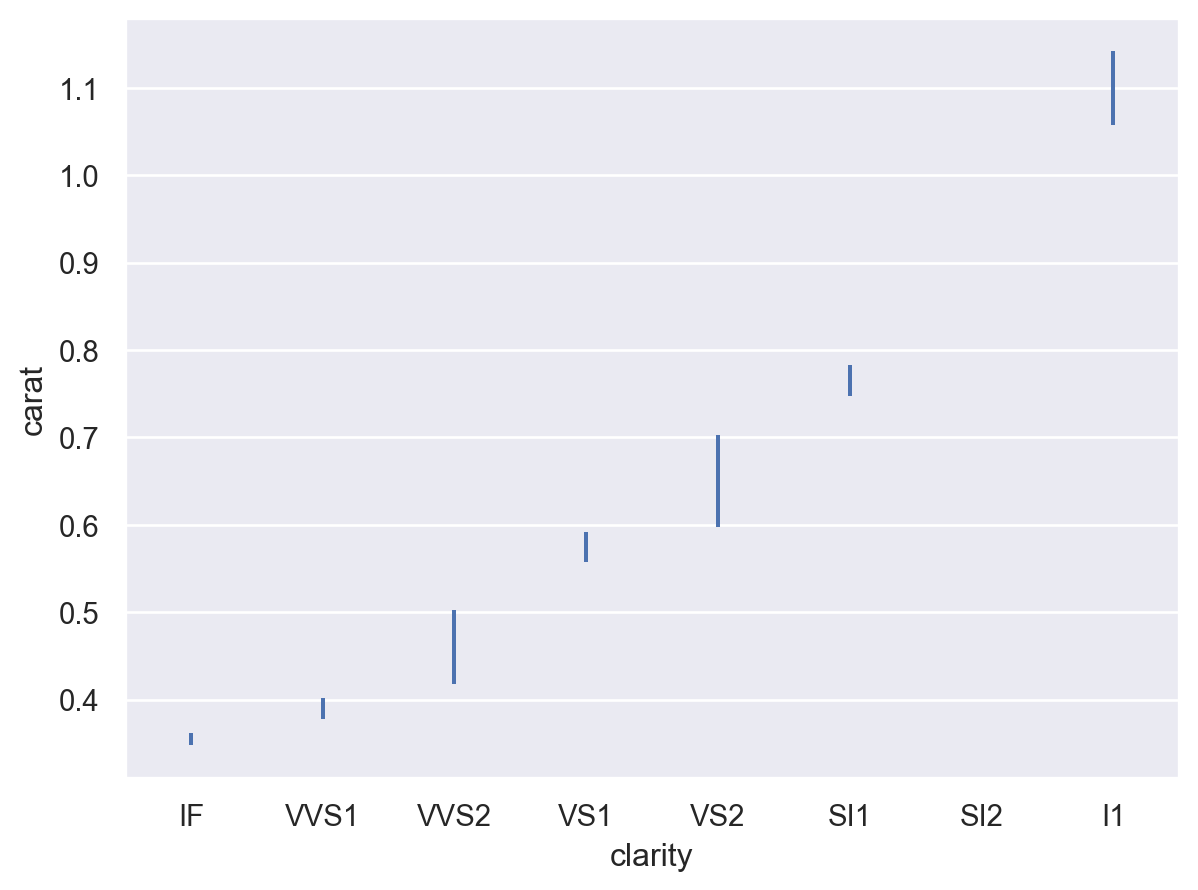
The default behavior is to compute the mean and 95% confidence interval (using bootstrapping):
p = so.Plot(diamonds, "clarity", "carat")
p.add(so.Range(), so.Est())

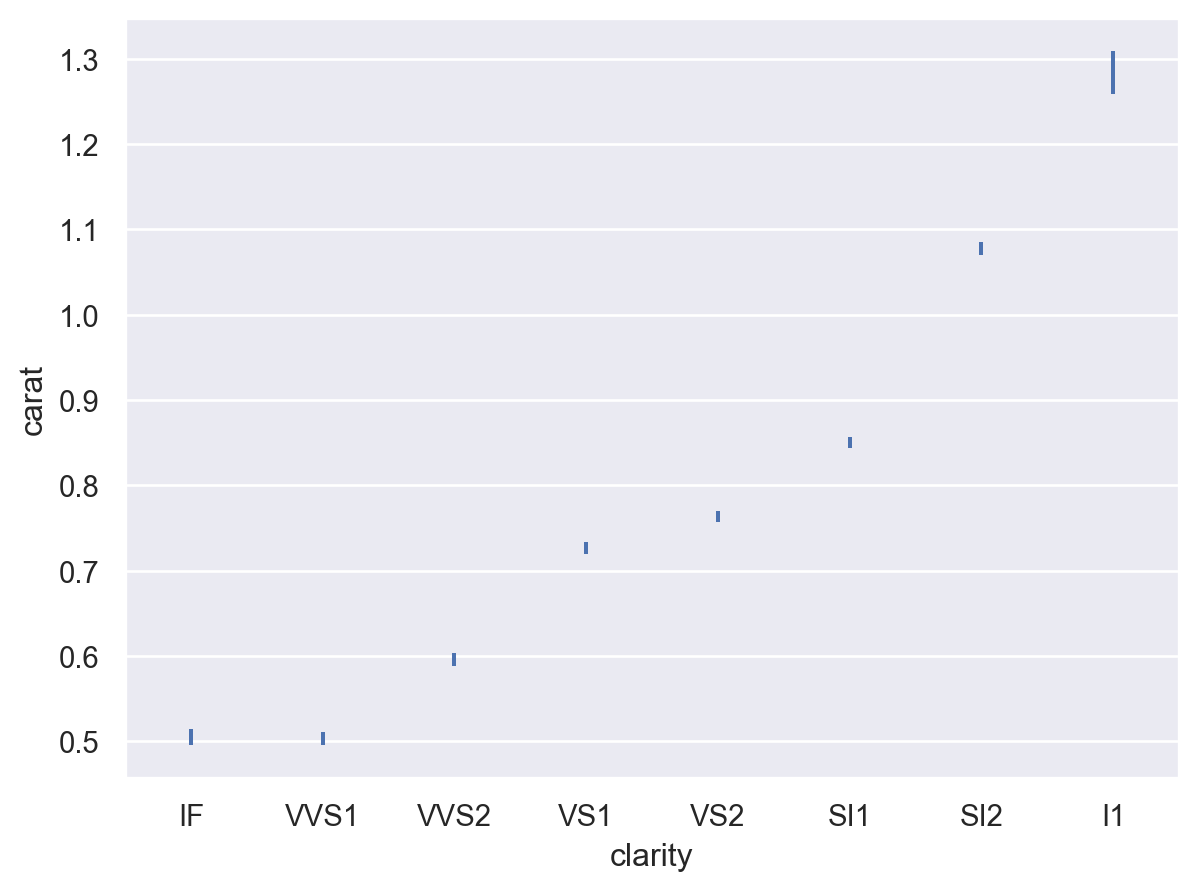
Other estimators may be selected by name if they are pandas methods:
p.add(so.Range(), so.Est("median"))

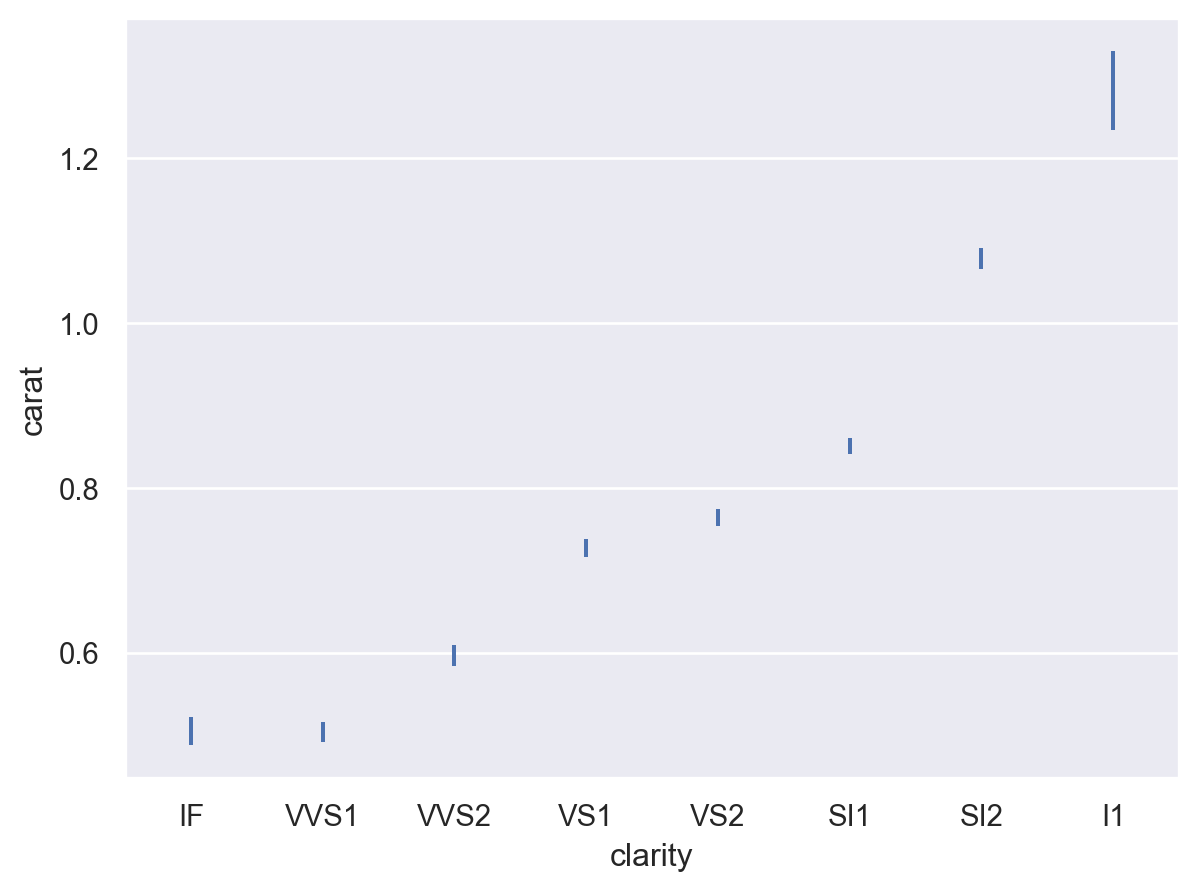
There are several options for computing the error bar interval, such as (scaled) standard errors:
p.add(so.Range(), so.Est(errorbar="se"))

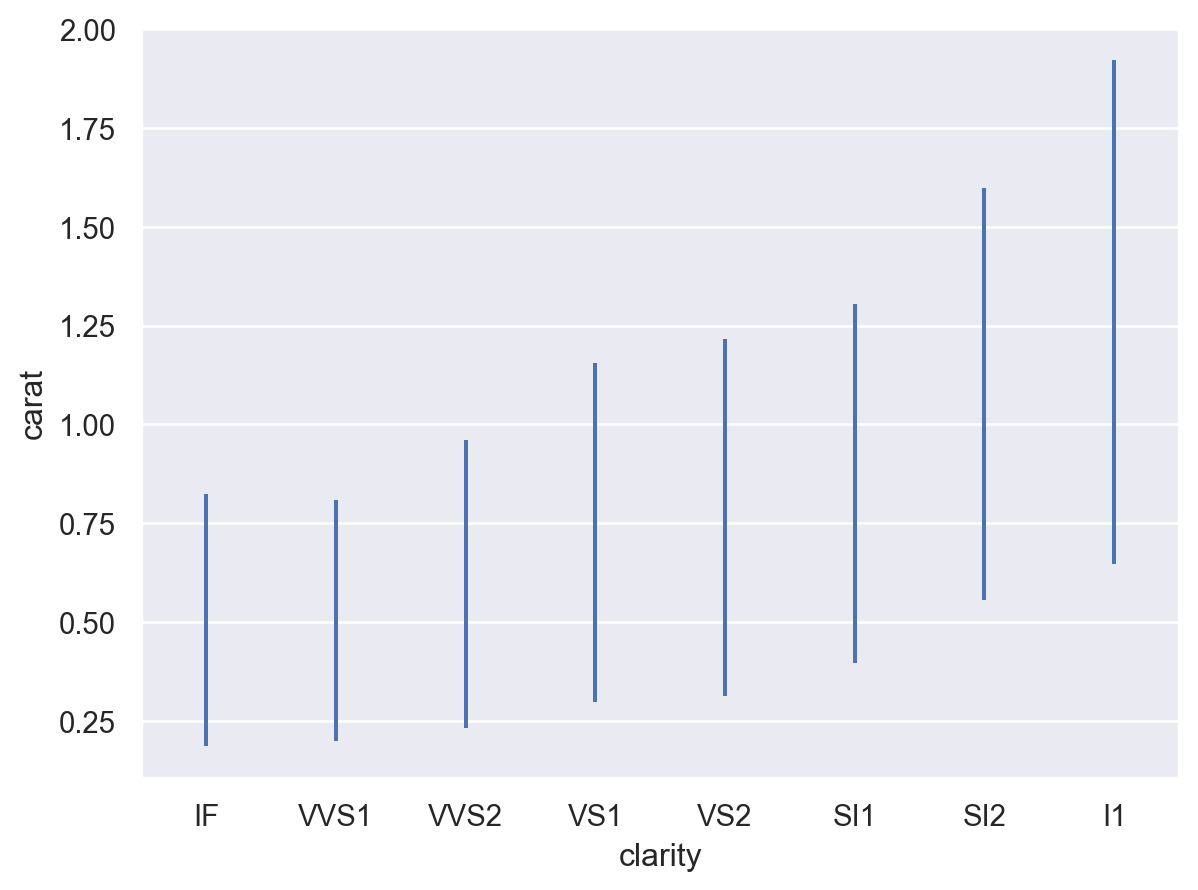
The error bars can also represent the spread of the distribution around the estimate using (scaled) standard deviations:
p.add(so.Range(), so.Est(errorbar="sd"))

Because confidence intervals are computed using bootstrapping, there will be small amounts of randomness. Reduce the random variability by increasing the nubmer of bootstrap iterations (although this will be slower), or eliminate it by seeding the random number generator:
p.add(so.Range(), so.Est(seed=0))
