seaborn.objects.Bars#
- class seaborn.objects.Bars(artist_kws=<factory>, color=<'C0'>, alpha=<0.7>, fill=<True>, edgecolor=<rc:patch.edgecolor>, edgealpha=<1>, edgewidth=<auto>, edgestyle=<'-'>, width=<1>, baseline=<0>)#
A faster bar mark with defaults more suitable histograms.
- This mark defines the following properties:
color, alpha, fill, edgecolor, edgealpha, edgewidth, edgestyle, |width|, |baseline|
See also
BarA bar mark drawn between baseline and data values.
Examples
This mark draws bars between a baseline and a value. In contrast to
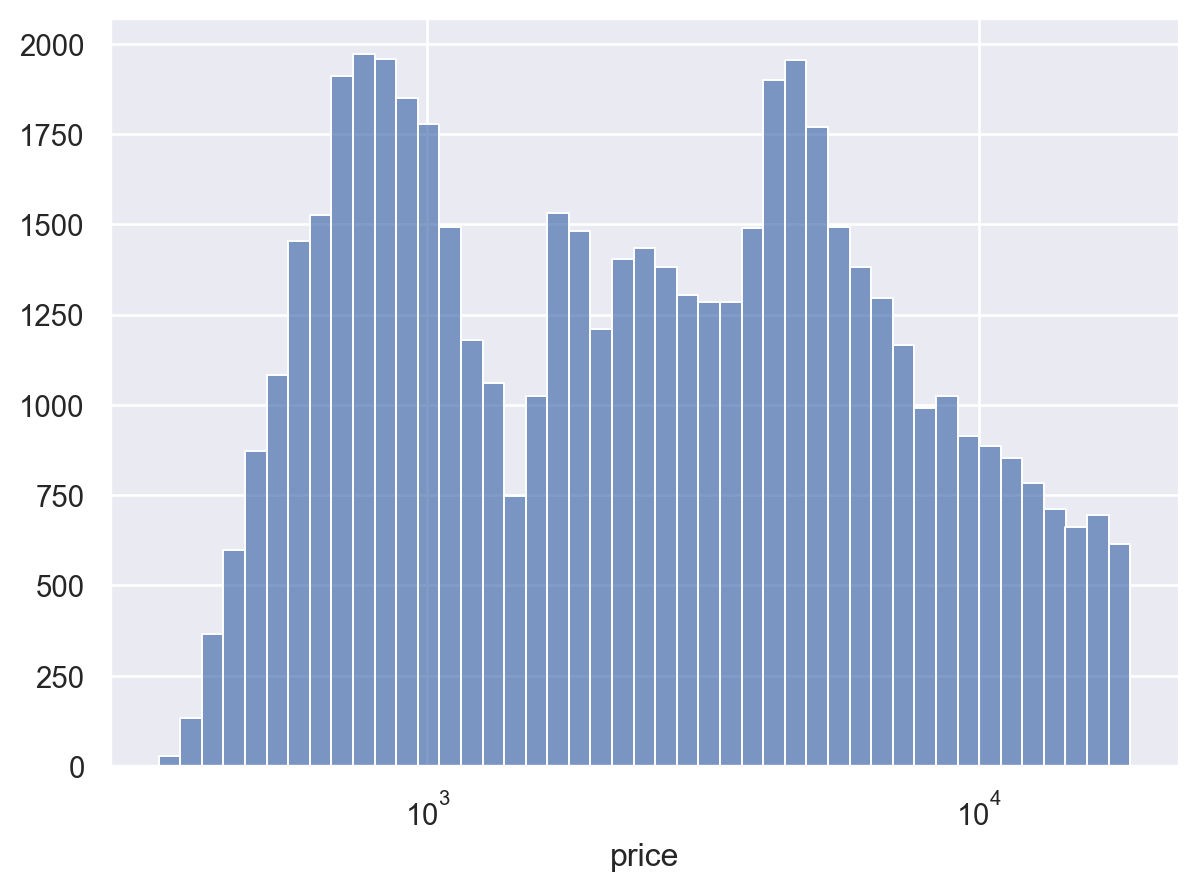
Bar, the bars have a full width and thin edges by default; this makes this mark a better choice for a continuous histogram:p = so.Plot(diamonds, "price").scale(x="log") p.add(so.Bars(), so.Hist())

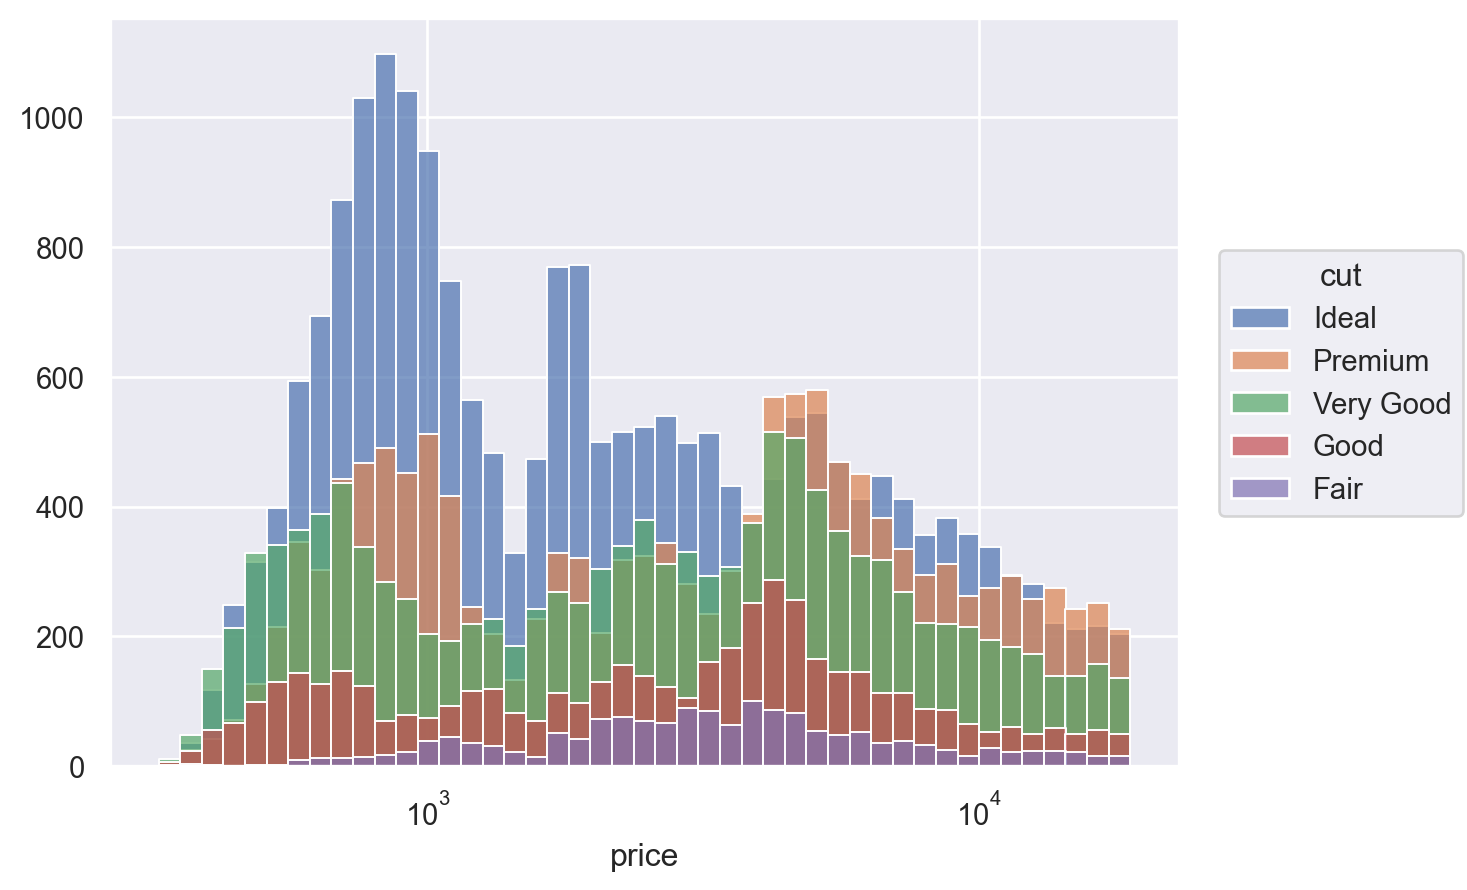
When mapping the color or other properties, bars will overlap by default; this is usually confusing:
p.add(so.Bars(), so.Hist(), color="cut")

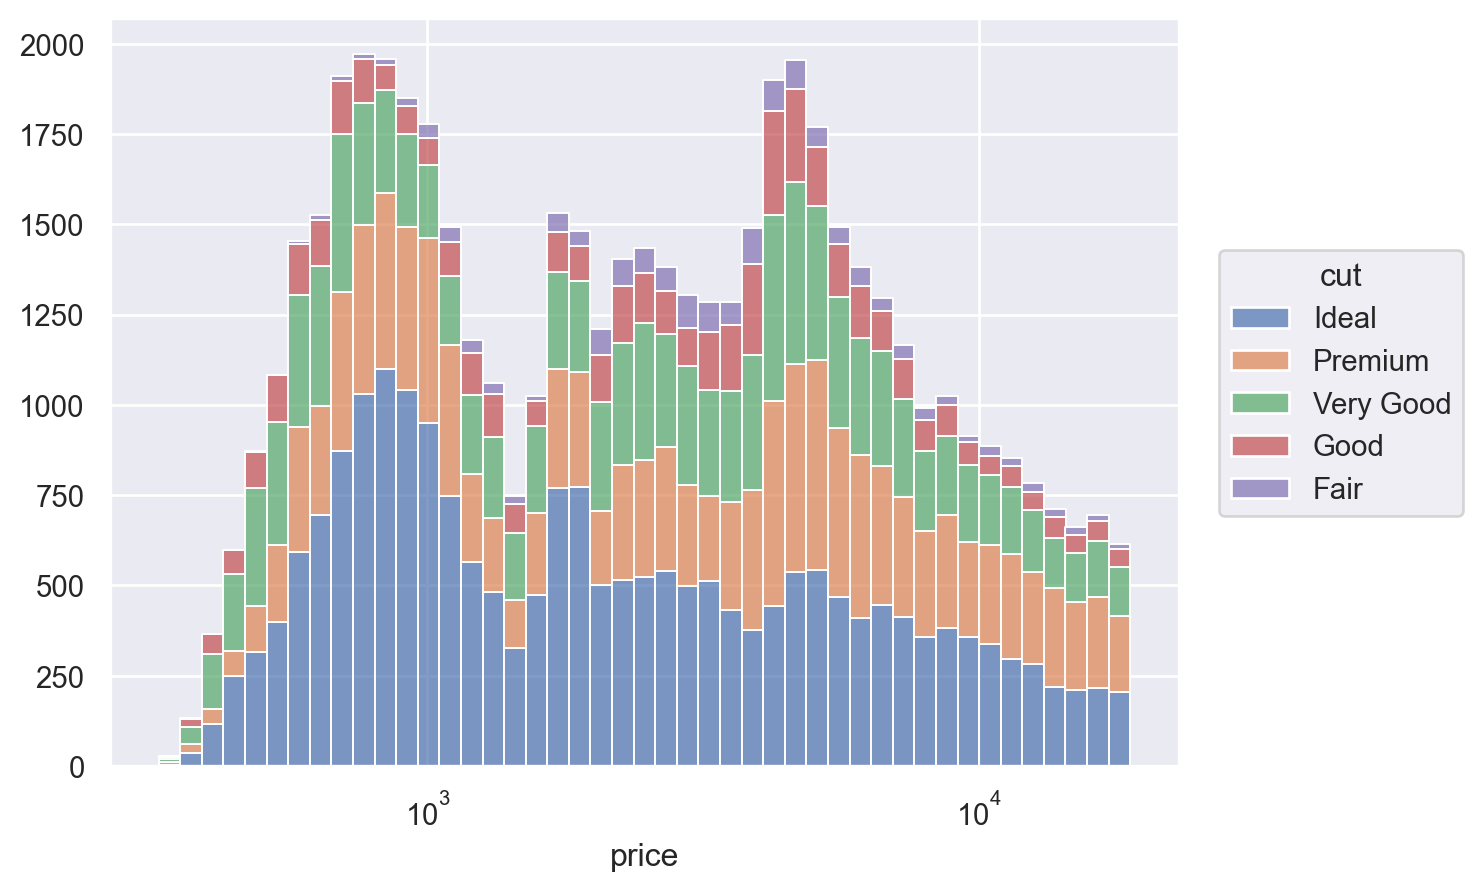
Using a move transform, such as
StackorDodge, will resolve the overlap (although faceting might often be a better approach):p.add(so.Bars(), so.Hist(), so.Stack(), color="cut")

A number of different properties can be set or mapped:
p.add(so.Bars(edgewidth=0), so.Hist(), so.Stack(), alpha="clarity")

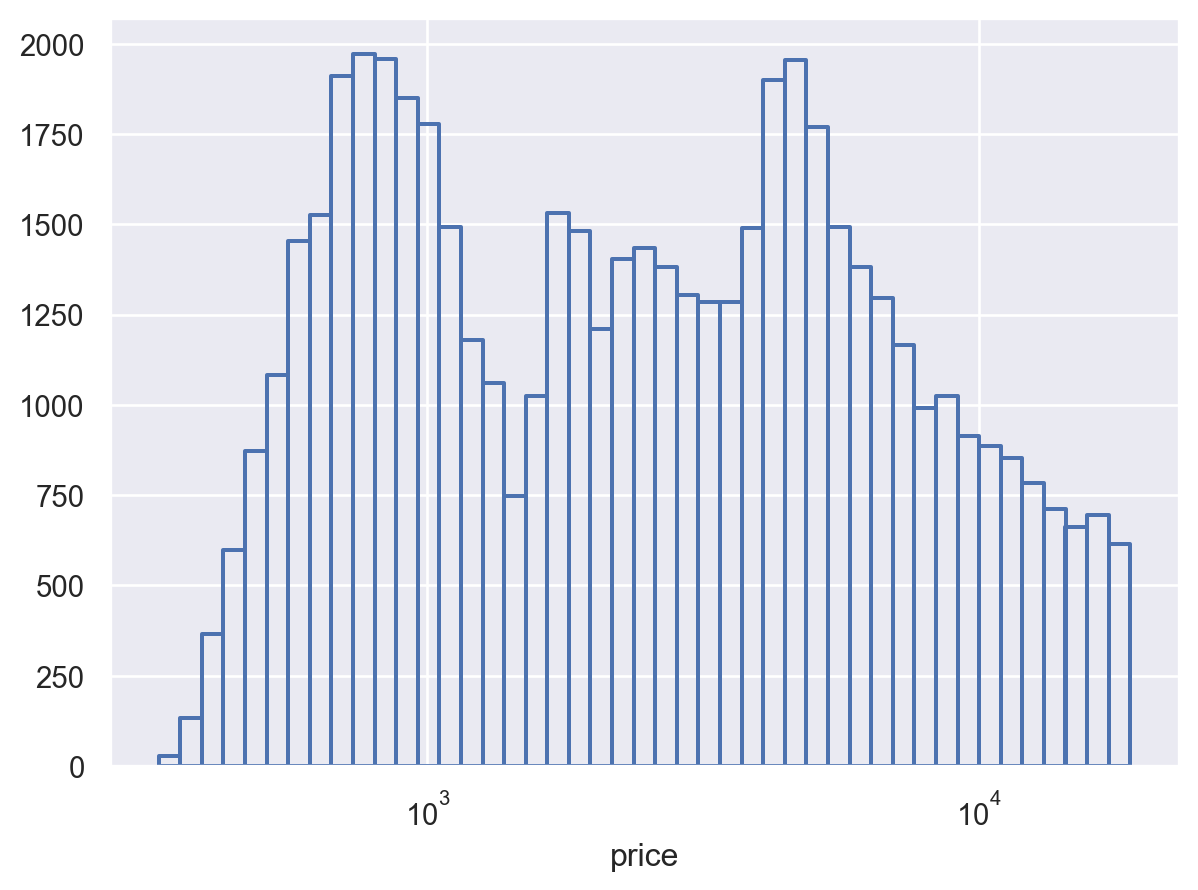
It is possible to draw unfilled bars, but you must override the default edge color:
p.add(so.Bars(fill=False, edgecolor="C0", edgewidth=1.5), so.Hist())

It is also possible to narrow the bars, which may be useful for dealing with overlap in some cases:
hist = so.Hist(binwidth=.075, binrange=(2, 5))
(
    p.add(so.Bars(), hist)
    .add(
        so.Bars(color=".9", width=.5), hist,
        data=diamonds.query("cut == 'Ideal'")
    )
)
