seaborn.PairGrid.__init__#
- PairGrid.__init__(data, *, hue=None, vars=None, x_vars=None, y_vars=None, hue_order=None, palette=None, hue_kws=None, corner=False, diag_sharey=True, height=2.5, aspect=1, layout_pad=0.5, despine=True, dropna=False)#
Initialize the plot figure and PairGrid object.
- Parameters:
- dataDataFrame
Tidy (long-form) dataframe where each column is a variable and each row is an observation.
- huestring (variable name)
Variable in
datato map plot aspects to different colors. This variable will be excluded from the default x and y variables.- varslist of variable names
Variables within
datato use, otherwise use every column with a numeric datatype.- {x, y}_varslists of variable names
Variables within
datato use separately for the rows and columns of the figure; i.e. to make a non-square plot.- hue_orderlist of strings
Order for the levels of the hue variable in the palette
- palettedict or seaborn color palette
Set of colors for mapping the
huevariable. If a dict, keys should be values in thehuevariable.- hue_kwsdictionary of param -> list of values mapping
Other keyword arguments to insert into the plotting call to let other plot attributes vary across levels of the hue variable (e.g. the markers in a scatterplot).
- cornerbool
If True, don’t add axes to the upper (off-diagonal) triangle of the grid, making this a “corner” plot.
- heightscalar
Height (in inches) of each facet.
- aspectscalar
Aspect * height gives the width (in inches) of each facet.
- layout_padscalar
Padding between axes; passed to
fig.tight_layout.- despineboolean
Remove the top and right spines from the plots.
- dropnaboolean
Drop missing values from the data before plotting.
See also
Examples
Calling the constructor sets up a blank grid of subplots with each row and one column corresponding to a numeric variable in the dataset:
penguins = sns.load_dataset("penguins")
g = sns.PairGrid(penguins)
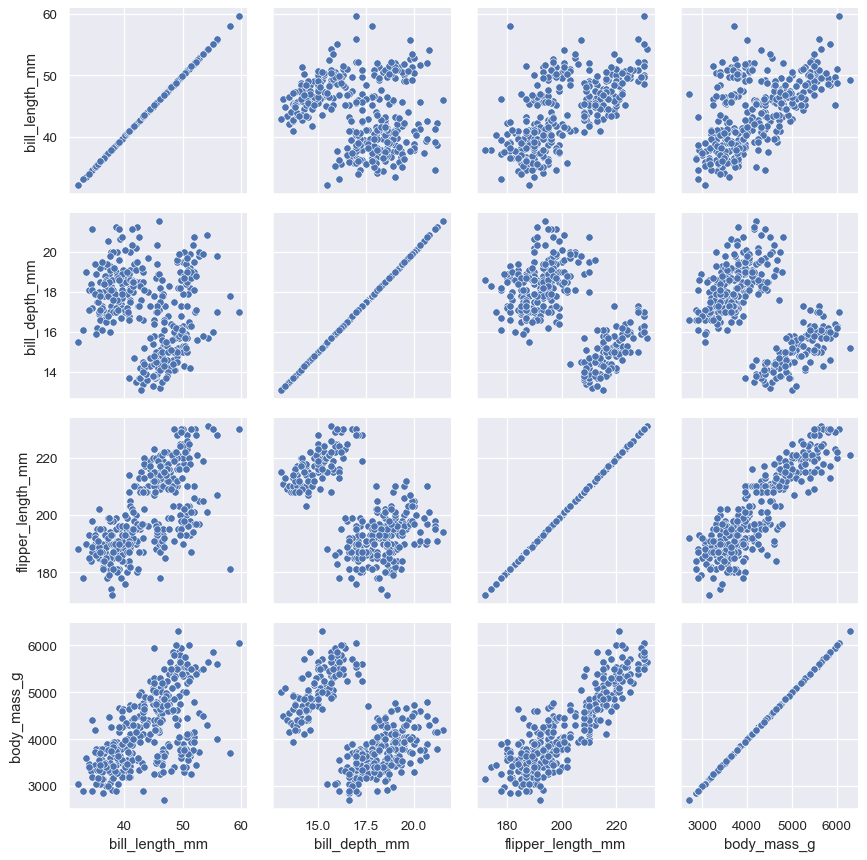
Passing a bivariate function to
PairGrid.map()will draw a bivariate plot on every axes:g = sns.PairGrid(penguins) g.map(sns.scatterplot)
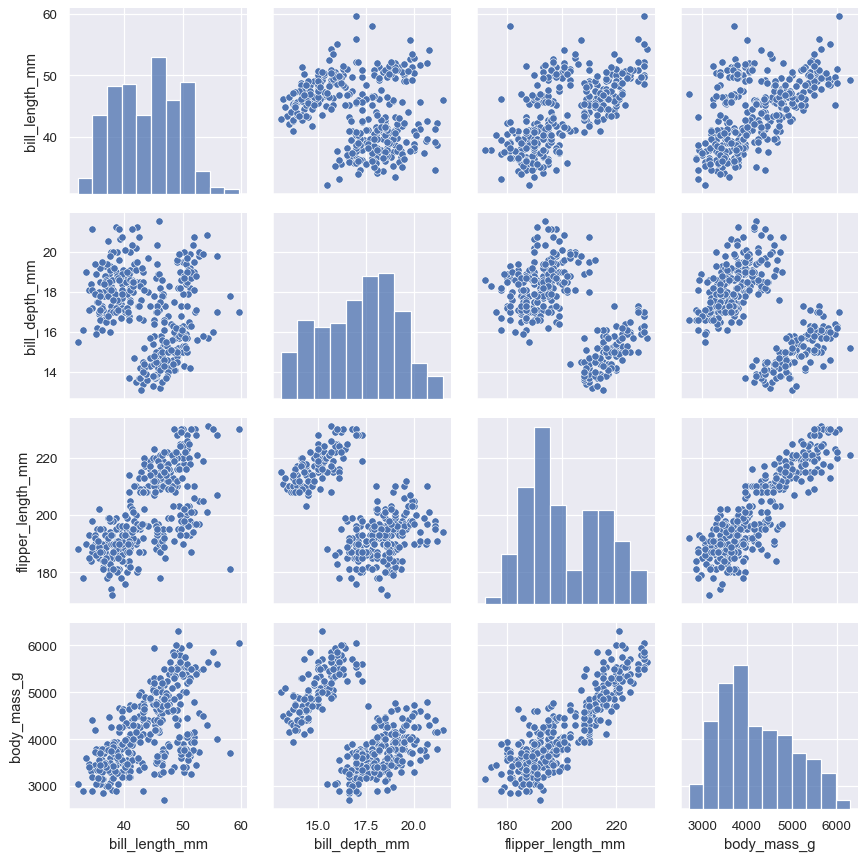
Passing separate functions to
PairGrid.map_diag()andPairGrid.map_offdiag()will show each variable’s marginal distribution on the diagonal:g = sns.PairGrid(penguins) g.map_diag(sns.histplot) g.map_offdiag(sns.scatterplot)
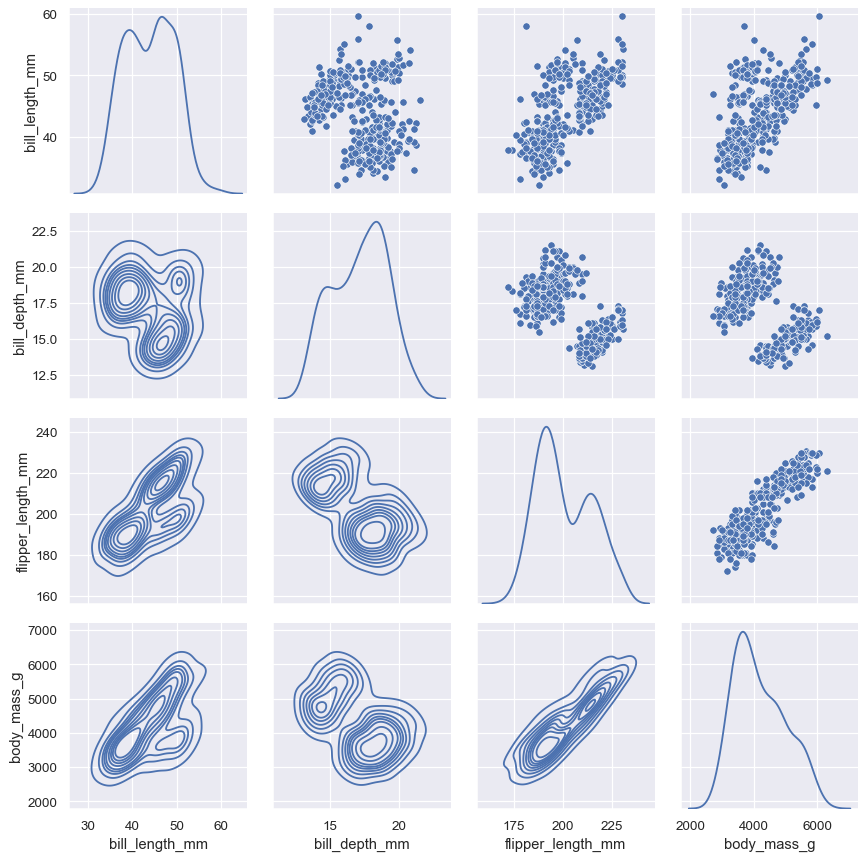
It’s also possible to use different functions on the upper and lower triangles of the plot (which are otherwise redundant):
g = sns.PairGrid(penguins, diag_sharey=False)
g.map_upper(sns.scatterplot)
g.map_lower(sns.kdeplot)
g.map_diag(sns.kdeplot)
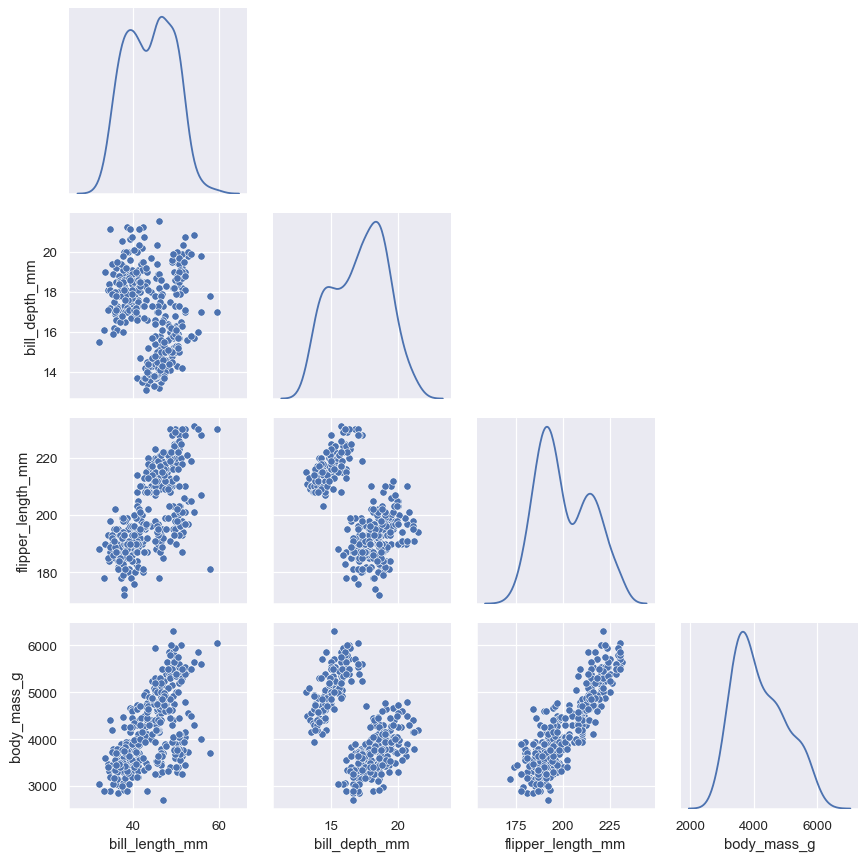
Or to avoid the redundancy altogether:
g = sns.PairGrid(penguins, diag_sharey=False, corner=True)
g.map_lower(sns.scatterplot)
g.map_diag(sns.kdeplot)
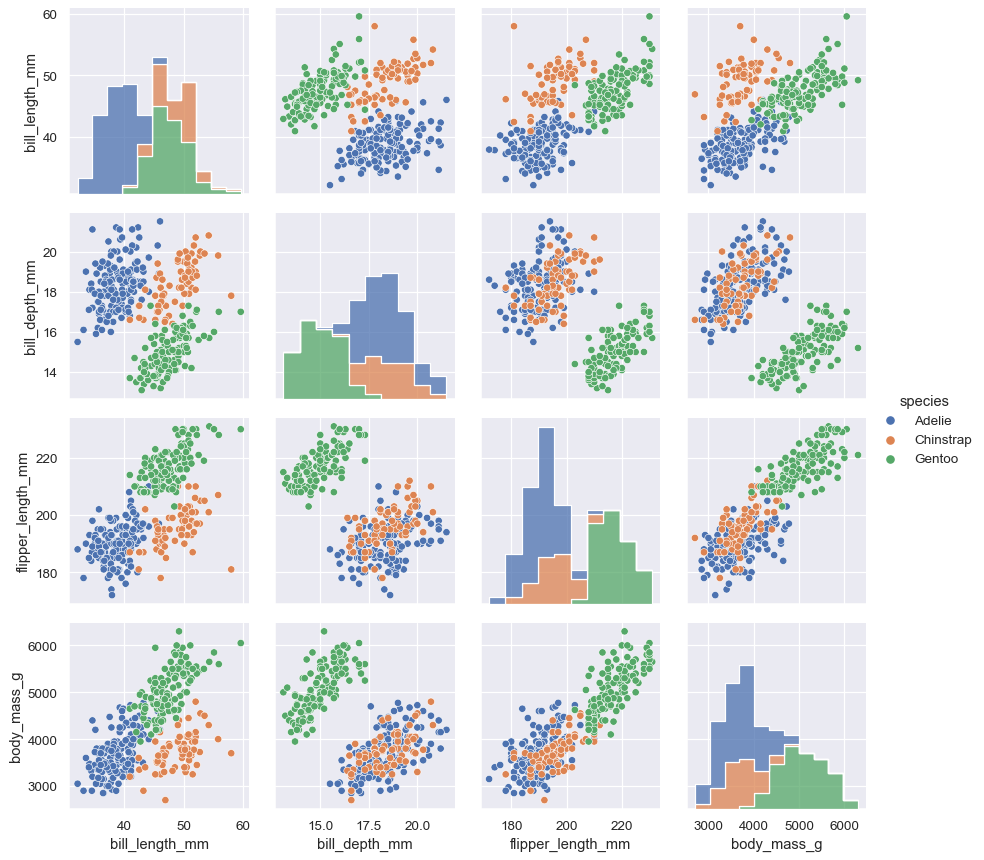
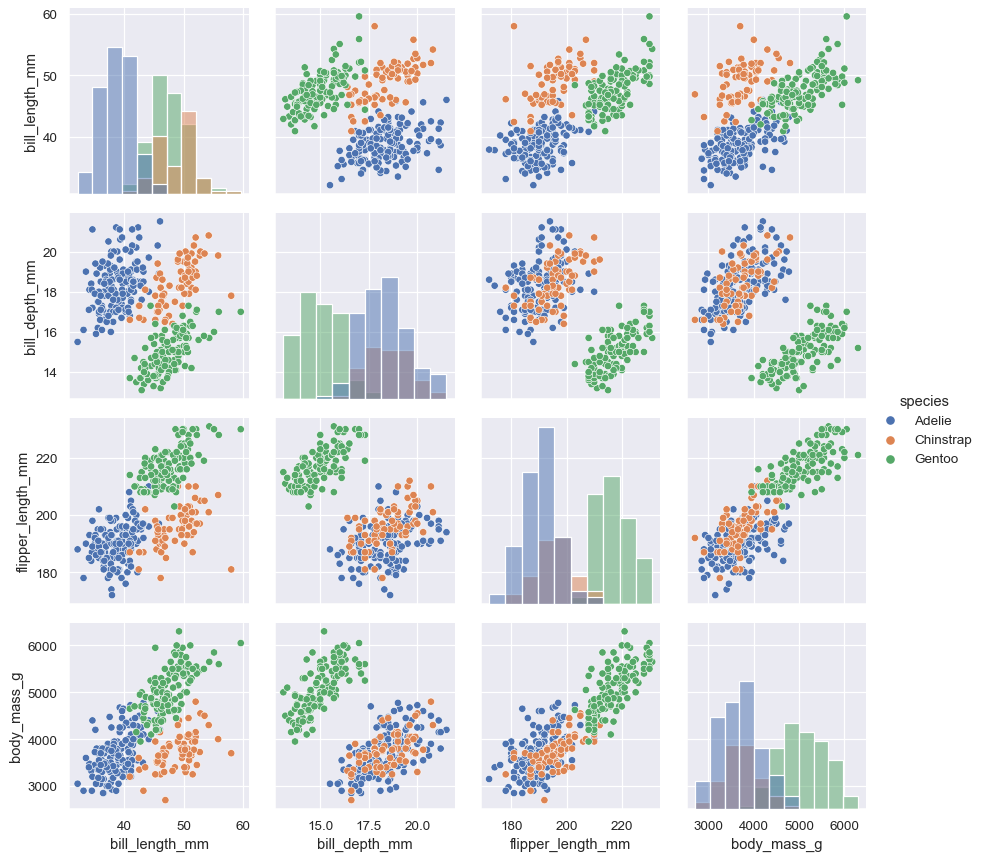
The
PairGridconstructor accepts ahuevariable. This variable is passed directly to functions that understand it:g = sns.PairGrid(penguins, hue="species") g.map_diag(sns.histplot) g.map_offdiag(sns.scatterplot) g.add_legend()
But you can also pass matplotlib functions, in which case a groupby is performed internally and a separate plot is drawn for each level:
g = sns.PairGrid(penguins, hue="species")
g.map_diag(plt.hist)
g.map_offdiag(plt.scatter)
g.add_legend()
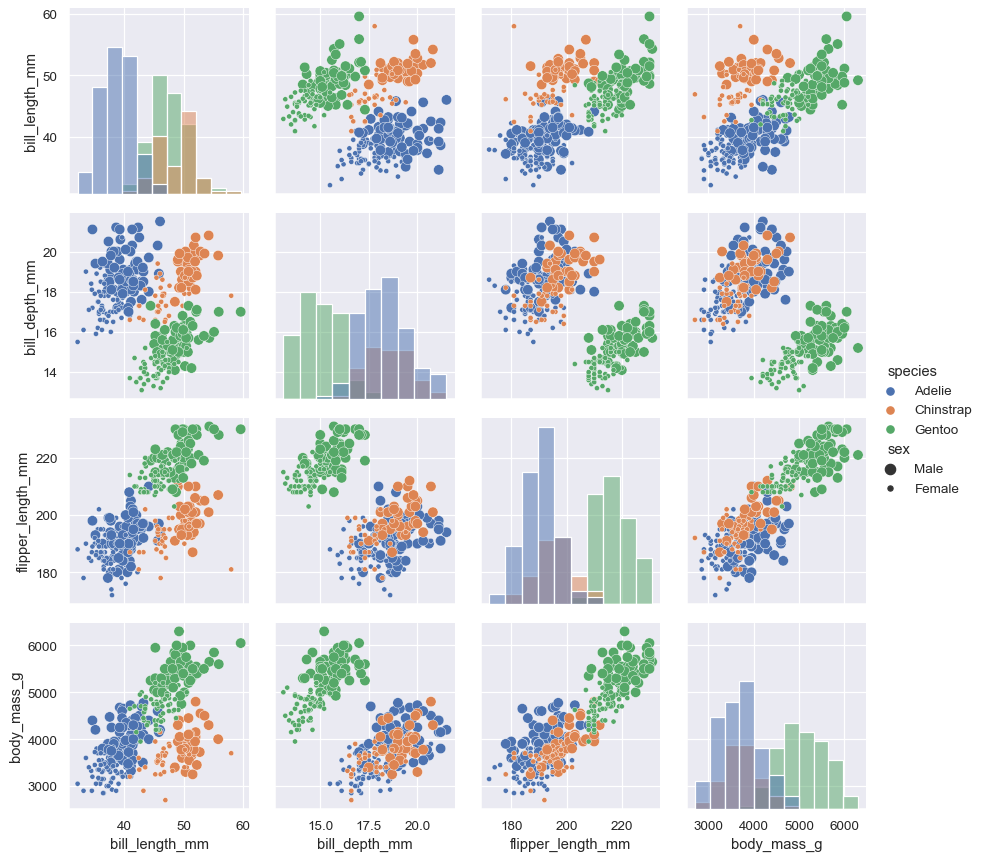
Additional semantic variables can be assigned by passing data vectors directly while mapping the function:
g = sns.PairGrid(penguins, hue="species")
g.map_diag(sns.histplot)
g.map_offdiag(sns.scatterplot, size=penguins["sex"])
g.add_legend(title="", adjust_subtitles=True)
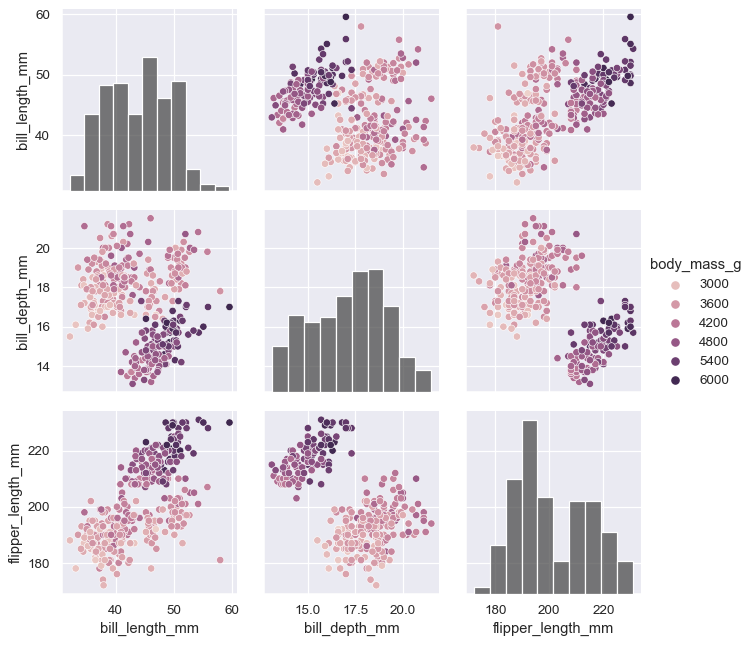
When using seaborn functions that can implement a numeric hue mapping, you will want to disable mapping of the variable on the diagonal axes. Note that the
huevariable is excluded from the list of variables shown by default:g = sns.PairGrid(penguins, hue="body_mass_g") g.map_diag(sns.histplot, hue=None, color=".3") g.map_offdiag(sns.scatterplot) g.add_legend()
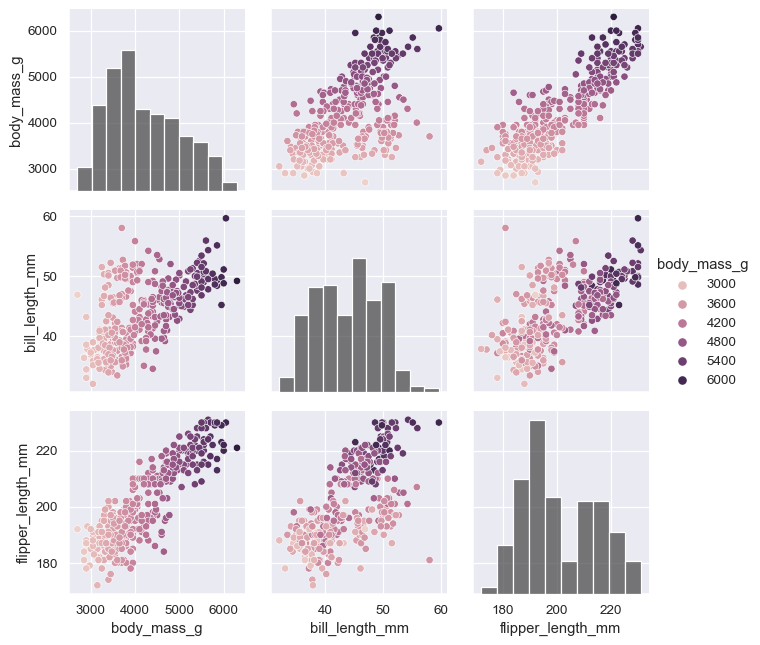
The
varsparameter can be used to control exactly which variables are used:variables = ["body_mass_g", "bill_length_mm", "flipper_length_mm"] g = sns.PairGrid(penguins, hue="body_mass_g", vars=variables) g.map_diag(sns.histplot, hue=None, color=".3") g.map_offdiag(sns.scatterplot) g.add_legend()
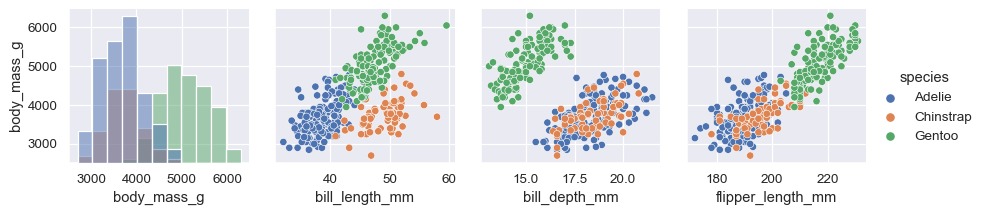
The plot need not be square: separate variables can be used to define the rows and columns:
x_vars = ["body_mass_g", "bill_length_mm", "bill_depth_mm", "flipper_length_mm"]
y_vars = ["body_mass_g"]
g = sns.PairGrid(penguins, hue="species", x_vars=x_vars, y_vars=y_vars)
g.map_diag(sns.histplot, color=".3")
g.map_offdiag(sns.scatterplot)
g.add_legend()
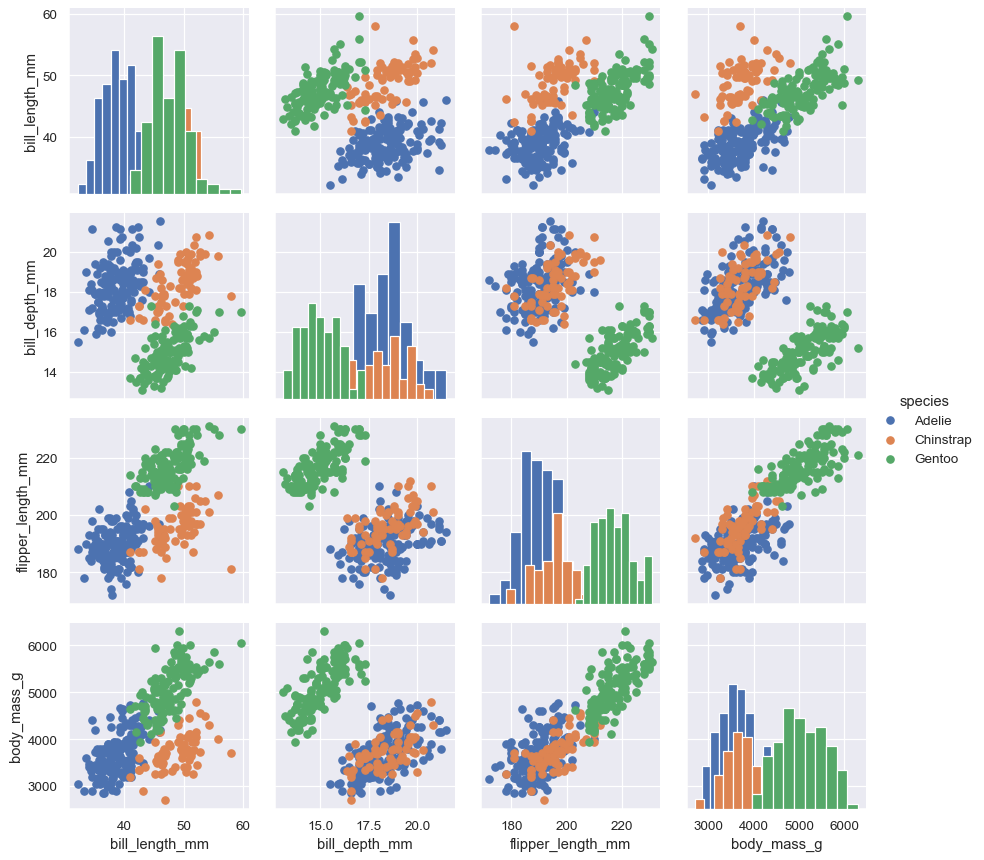
It can be useful to explore different approaches to resolving multiple distributions on the diagonal axes:
g = sns.PairGrid(penguins, hue="species")
g.map_diag(sns.histplot, multiple="stack", element="step")
g.map_offdiag(sns.scatterplot)
g.add_legend()