Annotated heatmaps#
seaborn components used: set_theme(), load_dataset(), heatmap()
import matplotlib.pyplot as plt
import seaborn as sns
sns.set_theme()
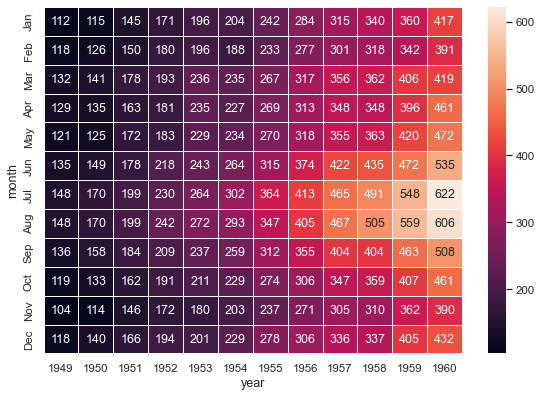
# Load the example flights dataset and convert to long-form
flights_long = sns.load_dataset("flights")
flights = (
flights_long
.pivot(index="month", columns="year", values="passengers")
)
# Draw a heatmap with the numeric values in each cell
f, ax = plt.subplots(figsize=(9, 6))
sns.heatmap(flights, annot=True, fmt="d", linewidths=.5, ax=ax)