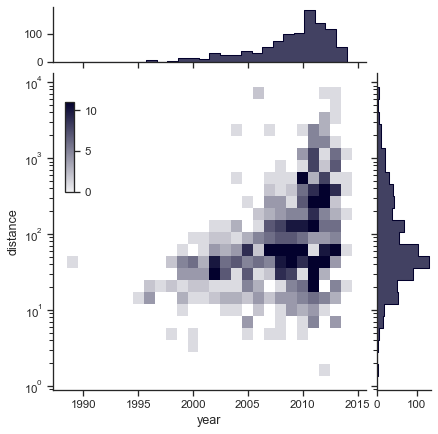
Joint and marginal histograms#
seaborn components used: set_theme(), load_dataset(), JointGrid
import seaborn as sns
sns.set_theme(style="ticks")

# Load the planets dataset and initialize the figure
planets = sns.load_dataset("planets")
g = sns.JointGrid(data=planets, x="year", y="distance", marginal_ticks=True)

# Set a log scaling on the y axis
g.ax_joint.set(yscale="log")

# Create an inset legend for the histogram colorbar
cax = g.figure.add_axes([.15, .55, .02, .2])

# Add the joint and marginal histogram plots
g.plot_joint(
    sns.histplot, discrete=(True, False),
    cmap="light:#03012d", pmax=.8, cbar=True, cbar_ax=cax
)
g.plot_marginals(sns.histplot, element="step", color="#03012d")