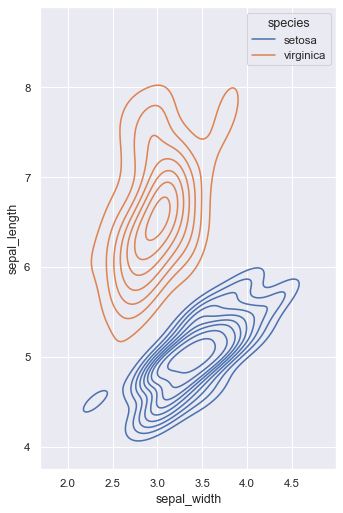
Multiple bivariate KDE plots#
seaborn components used: set_theme(), load_dataset(), kdeplot()
import seaborn as sns
import matplotlib.pyplot as plt

sns.set_theme(style="darkgrid")
iris = sns.load_dataset("iris")

# Set up the figure
f, ax = plt.subplots(figsize=(8, 8))
ax.set_aspect("equal")

# Draw a contour plot to represent each bivariate density
sns.kdeplot(
    data=iris.query("species != 'versicolor'"),
    x="sepal_width",
    y="sepal_length",
    hue="species",
    thresh=.1,
)