Grouped violinplots with split violins#
seaborn components used: set_theme(), load_dataset(), violinplot()
import seaborn as sns
sns.set_theme(style="dark")
# Load the example tips dataset
tips = sns.load_dataset("tips")
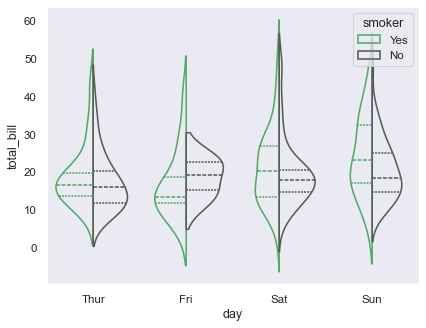
# Draw a nested violinplot and split the violins for easier comparison
sns.violinplot(data=tips, x="day", y="total_bill", hue="smoker",
split=True, inner="quart", fill=False,
palette={"Yes": "g", "No": ".35"})