Multiple linear regression#
seaborn components used: set_theme(), load_dataset(), lmplot()
import seaborn as sns
sns.set_theme()
# Load the penguins dataset
penguins = sns.load_dataset("penguins")
# Plot sepal width as a function of sepal_length across days
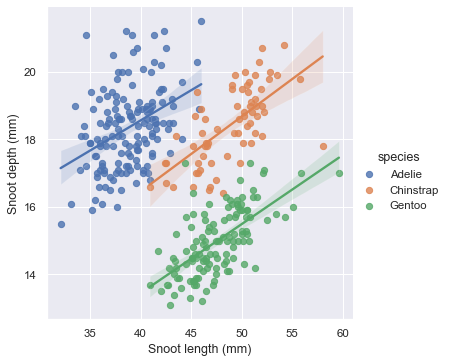
g = sns.lmplot(
data=penguins,
x="bill_length_mm", y="bill_depth_mm", hue="species",
height=5
)
# Use more informative axis labels than are provided by default
g.set_axis_labels("Snoot length (mm)", "Snoot depth (mm)")