Horizontal, unfilled violinplots#
seaborn components used: set_theme(), load_dataset(), violinplot()
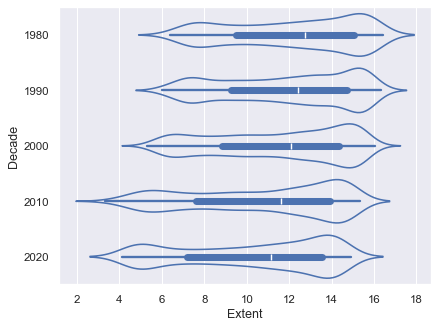
import seaborn as sns

sns.set_theme()

seaice = sns.load_dataset("seaice")
seaice["Decade"] = seaice["Date"].dt.year.round(-1)
sns.violinplot(seaice, x="Extent", y="Decade", orient="y", fill=False)