Bivariate plot with multiple elements#
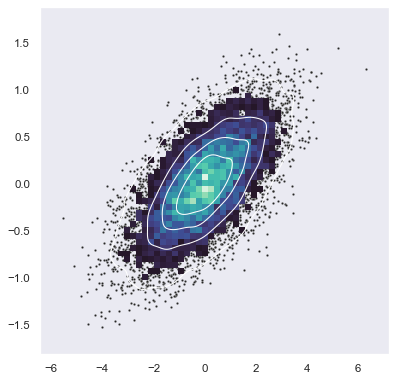
seaborn components used: set_theme(), scatterplot(), histplot(), kdeplot()
import numpy as np
import seaborn as sns
import matplotlib.pyplot as plt
sns.set_theme(style="dark")

# Simulate data from a bivariate Gaussian
n = 10000
mean = [0, 0]
cov = [(2, .4), (.4, .2)]
rng = np.random.RandomState(0)
x, y = rng.multivariate_normal(mean, cov, n).T

# Draw a combo histogram and scatterplot with density contours
f, ax = plt.subplots(figsize=(6, 6))
sns.scatterplot(x=x, y=y, s=5, color=".15")
sns.histplot(x=x, y=y, bins=50, pthresh=.1, cmap="mako")
sns.kdeplot(x=x, y=y, levels=5, color="w", linewidths=1)