Plotting model residuals#
seaborn components used: set_theme(), residplot()
import numpy as np
import seaborn as sns
sns.set_theme(style="whitegrid")
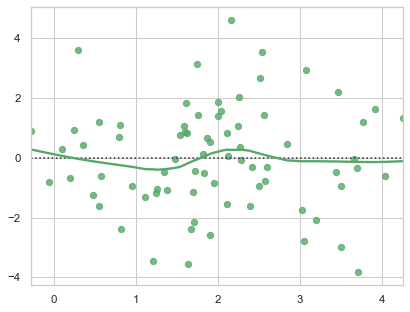
# Make an example dataset with y ~ x
rs = np.random.RandomState(7)
x = rs.normal(2, 1, 75)
y = 2 + 1.5 * x + rs.normal(0, 2, 75)
# Plot the residuals after fitting a linear model
sns.residplot(x=x, y=y, lowess=True, color="g")