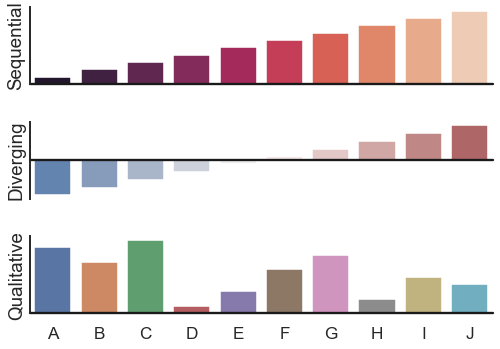
Color palette choices#
seaborn components used: set_theme(), barplot(), barplot(), barplot(), despine()
import numpy as np
import seaborn as sns
import matplotlib.pyplot as plt
sns.set_theme(style="white", context="talk")
rs = np.random.RandomState(8)

# Set up the matplotlib figure
f, (ax1, ax2, ax3) = plt.subplots(3, 1, figsize=(7, 5), sharex=True)

# Generate some sequential data
x = np.array(list("ABCDEFGHIJ"))
y1 = np.arange(1, 11)
sns.barplot(x=x, y=y1, hue=x, palette="rocket", ax=ax1)
ax1.axhline(0, color="k", clip_on=False)
ax1.set_ylabel("Sequential")

# Center the data to make it diverging
y2 = y1 - 5.5
sns.barplot(x=x, y=y2, hue=x, palette="vlag", ax=ax2)
ax2.axhline(0, color="k", clip_on=False)
ax2.set_ylabel("Diverging")

# Randomly reorder the data to make it qualitative
y3 = rs.choice(y1, len(y1), replace=False)
sns.barplot(x=x, y=y3, hue=x, palette="deep", ax=ax3)
ax3.axhline(0, color="k", clip_on=False)
ax3.set_ylabel("Qualitative")

# Finalize the plot
sns.despine(bottom=True)
plt.setp(f.axes, yticks=[])
plt.tight_layout(h_pad=2)