Paired categorical plots
seaborn components used: set_theme(), load_dataset(), PairGrid, despine()
import seaborn as sns
sns.set_theme(style="whitegrid")
# Load the example Titanic dataset
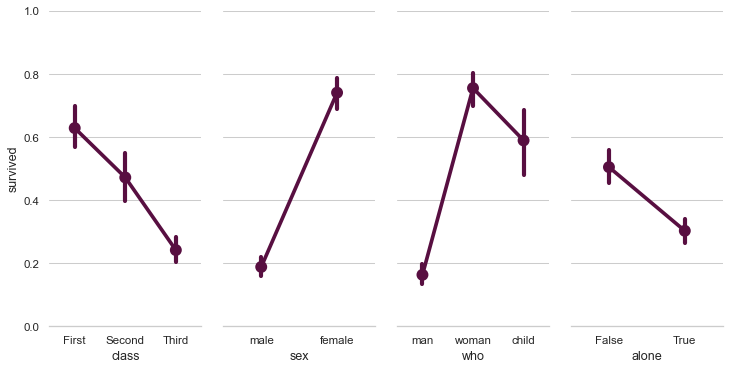
titanic = sns.load_dataset("titanic")
# Set up a grid to plot survival probability against several variables
g = sns.PairGrid(titanic, y_vars="survived",
x_vars=["class", "sex", "who", "alone"],
height=5, aspect=.5)
# Draw a seaborn pointplot onto each Axes
g.map(sns.pointplot, scale=1.3, errwidth=4, color="xkcd:plum")
g.set(ylim=(0, 1))
sns.despine(fig=g.fig, left=True)