Hexbin plot with marginal distributions
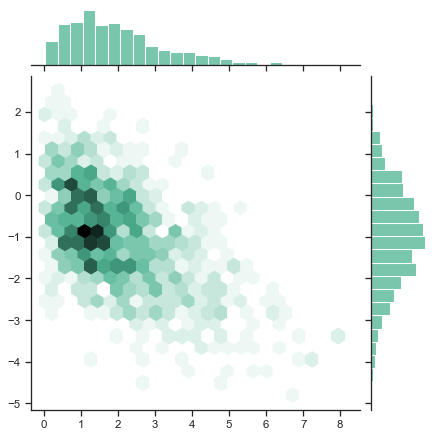
seaborn components used: set_theme(), jointplot()
import numpy as np
import seaborn as sns
sns.set_theme(style="ticks")

rs = np.random.RandomState(11)
x = rs.gamma(2, size=1000)
y = -.5 * x + rs.normal(size=1000)

sns.jointplot(x=x, y=y, kind="hex", color="#4CB391")