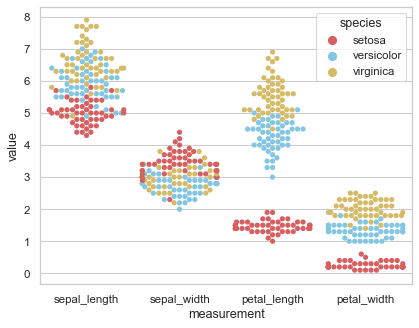
Scatterplot with categorical variables
Python source code: [download source: scatterplot_categorical.py]
import pandas as pd
import seaborn as sns
sns.set(style="whitegrid", palette="muted")

# Load the example iris dataset
iris = sns.load_dataset("iris")

# "Melt" the dataset to "long-form" or "tidy" representation
iris = pd.melt(iris, "species", var_name="measurement")

# Draw a categorical scatterplot to show each observation
sns.swarmplot(x="measurement", y="value", hue="species",
              palette=["r", "c", "y"], data=iris)