seaborn
0.10.1
Gallery
Tutorial
API
Site
Introduction
Release notes
Installing
Example gallery
Tutorial
API reference
Page
Official seaborn tutorial
Official seaborn tutorial
Plotting functions
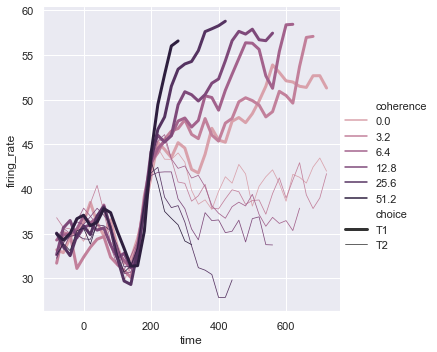
Visualizing statistical relationships
Relating variables with scatter plots
Emphasizing continuity with line plots
Showing multiple relationships with facets
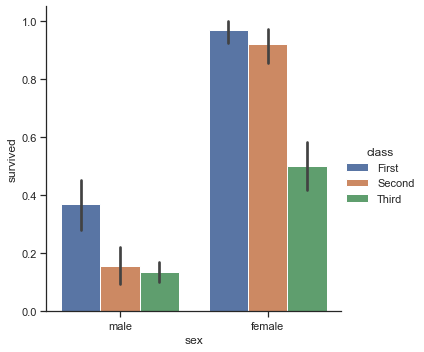
Plotting with categorical data
Categorical scatterplots
Distributions of observations within categories
Statistical estimation within categories
Plotting “wide-form” data
Showing multiple relationships with facets
Visualizing the distribution of a dataset
Plotting univariate distributions
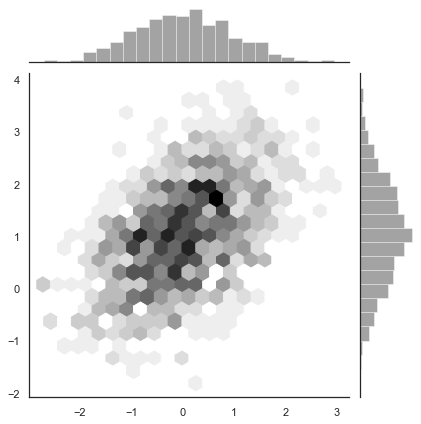
Plotting bivariate distributions
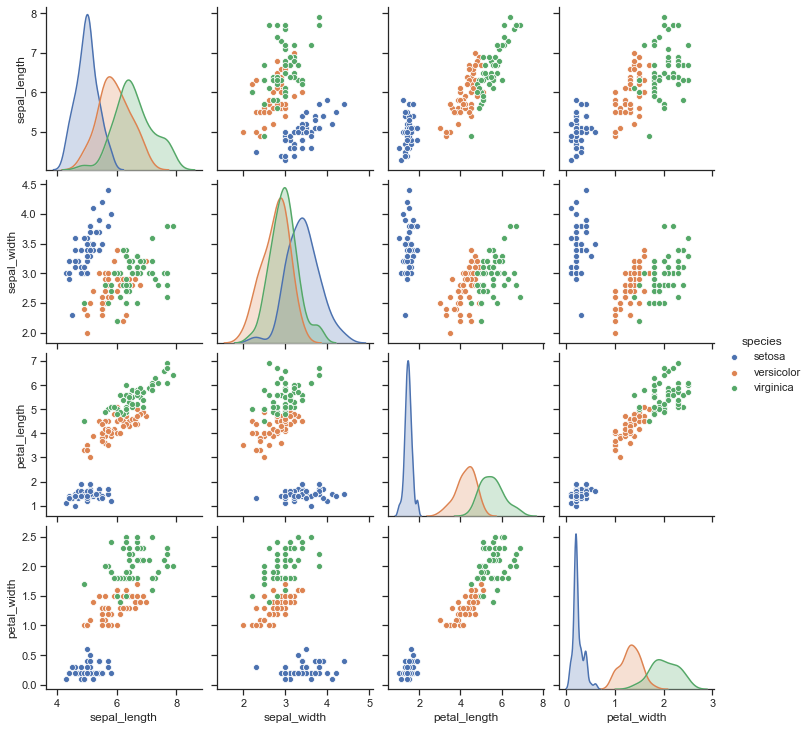
Visualizing pairwise relationships in a dataset
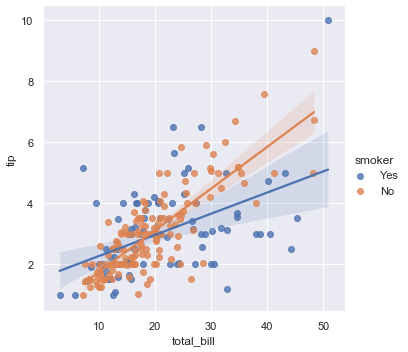
Visualizing linear relationships
Functions to draw linear regression models
Fitting different kinds of models
Conditioning on other variables
Controlling the size and shape of the plot
Plotting a regression in other contexts
Multi-plot grids
Building structured multi-plot grids
Conditional small multiples
Using custom functions
Plotting pairwise data relationships
Plot aesthetics
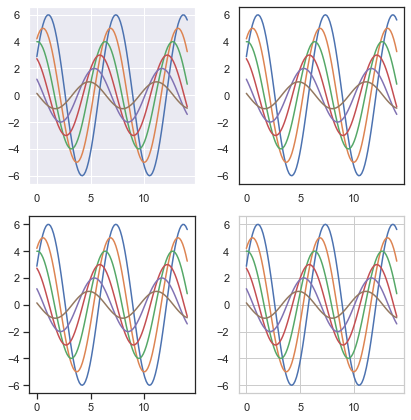
Controlling figure aesthetics
Seaborn figure styles
Removing axes spines
Temporarily setting figure style
Overriding elements of the seaborn styles
Scaling plot elements
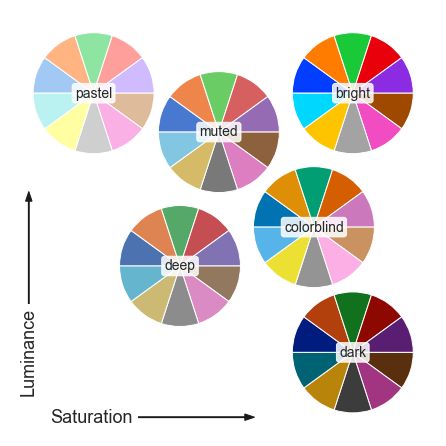
Choosing color palettes
Building color palettes
Qualitative color palettes
Sequential color palettes
Diverging color palettes
Setting the default color palette