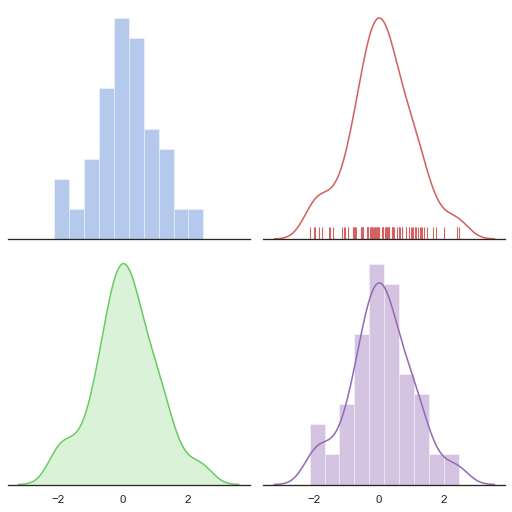
Distribution plot options

Python source code: [download source: distplot_options.py]
import numpy as np
import seaborn as sns
import matplotlib.pyplot as plt

sns.set(style="white", palette="muted", color_codes=True)
rs = np.random.RandomState(10)

# Set up the matplotlib figure
f, axes = plt.subplots(2, 2, figsize=(7, 7), sharex=True)
sns.despine(left=True)

# Generate a random univariate dataset
d = rs.normal(size=100)

# Plot a simple histogram with binsize determined automatically
sns.distplot(d, kde=False, color="b", ax=axes[0, 0])

# Plot a kernel density estimate and rug plot
sns.distplot(d, hist=False, rug=True, color="r", ax=axes[0, 1])

# Plot a filled kernel density estimate
sns.distplot(d, hist=False, color="g", kde_kws={"shade": True}, ax=axes[1, 0])

# Plot a histogram and kernel density estimate
sns.distplot(d, color="m", ax=axes[1, 1])

plt.setp(axes, yticks=[])
plt.tight_layout()