seaborn.move_legend(obj, loc, **kwargs)¶Recreate a plot’s legend at a new location.
The name is a slight misnomer. Matplotlib legends do not expose public control over their position parameters. So this function creates a new legend, copying over the data from the original object, which is then removed.
This argument can be either a seaborn or matplotlib object:
Location argument, as in matplotlib.axes.Axes.legend().
Other keyword arguments are passed to matplotlib.axes.Axes.legend().
Examples
For axes-level functions, pass the matplotlib.axes.Axes object and provide a new location.
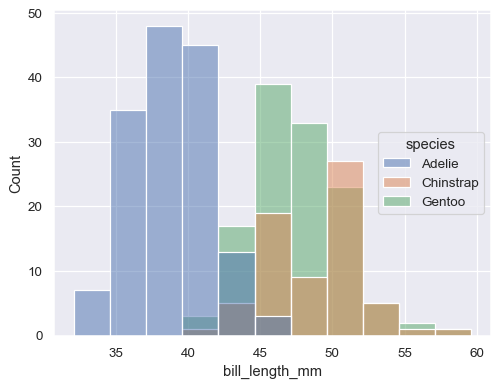
ax = sns.histplot(penguins, x="bill_length_mm", hue="species")
sns.move_legend(ax, "center right")
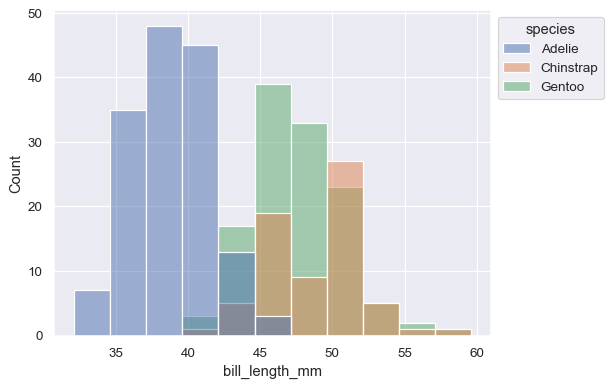
Use the bbox_to_anchor parameter for more fine-grained control, including moving the legend outside of the axes:
ax = sns.histplot(penguins, x="bill_length_mm", hue="species")
sns.move_legend(ax, "upper left", bbox_to_anchor=(1, 1))
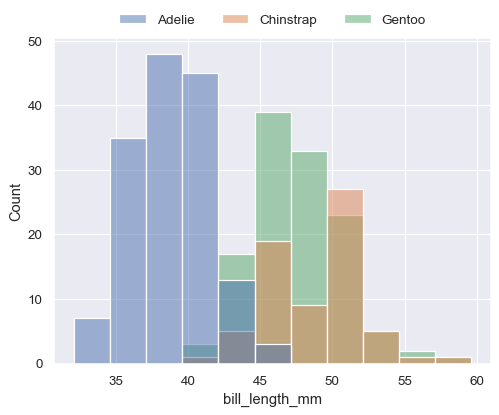
Pass additional matplotlib.axes.Axes.legend() parameters to update other properties:
ax = sns.histplot(penguins, x="bill_length_mm", hue="species")
sns.move_legend(
    ax, "lower center",
    bbox_to_anchor=(.5, 1), ncol=3, title=None, frameon=False,
)
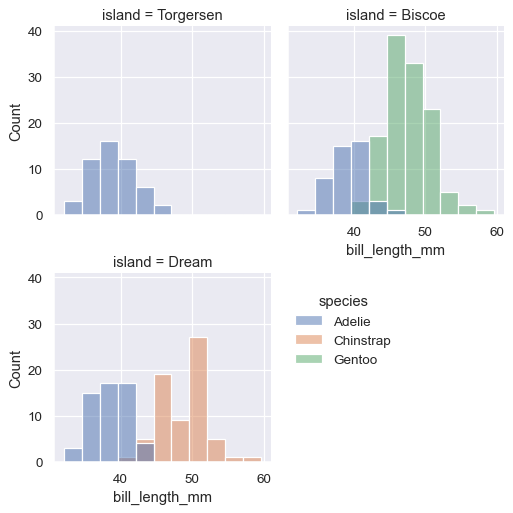
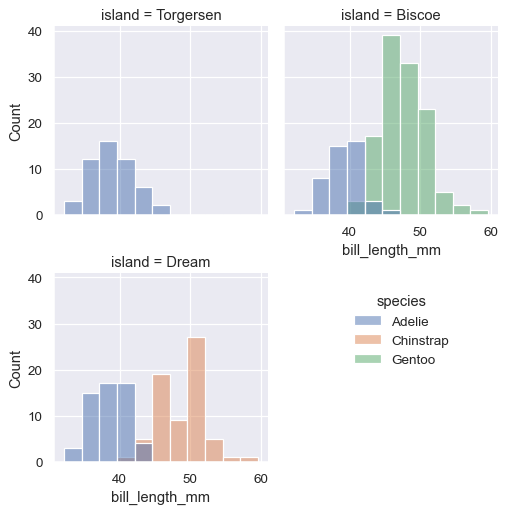
It’s also possible to move the legend created by a figure-level function. But when fine-tuning the position, you must bear in mind that the figure will have extra blank space on the right:
g = sns.displot(
    penguins,
    x="bill_length_mm", hue="species",
    col="island", col_wrap=2, height=3,
)
sns.move_legend(g, "upper left", bbox_to_anchor=(.55, .45))
One way to avoid this would be to set legend_out=False on the FacetGrid:
g = sns.displot(
    penguins,
    x="bill_length_mm", hue="species",
    col="island", col_wrap=2, height=3,
    facet_kws=dict(legend_out=False),
)
sns.move_legend(g, "upper left", bbox_to_anchor=(.55, .45), frameon=False)
