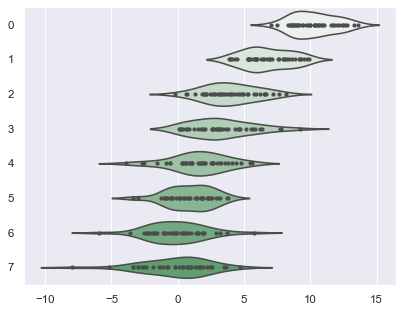
Violinplots with observations
seaborn components used: set_theme(), violinplot()
import numpy as np
import seaborn as sns

sns.set_theme()

# Create a random dataset across several variables
rs = np.random.default_rng(0)
n, p = 40, 8
d = rs.normal(0, 2, (n, p))
d += np.log(np.arange(1, p + 1)) * -5 + 10

# Show each distribution with both violins and points
sns.violinplot(data=d, palette="light:g", inner="points", orient="h")