Plotting large distributions
seaborn components used: set_theme(), load_dataset(), boxenplot()
import seaborn as sns
sns.set_theme(style="whitegrid")
diamonds = sns.load_dataset("diamonds")
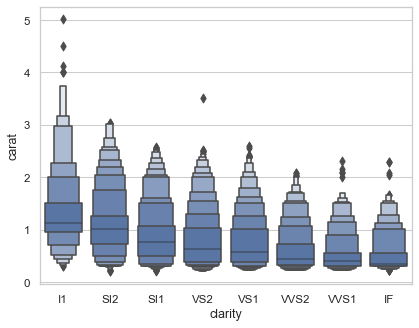
clarity_ranking = ["I1", "SI2", "SI1", "VS2", "VS1", "VVS2", "VVS1", "IF"]
sns.boxenplot(x="clarity", y="carat",
color="b", order=clarity_ranking,
scale="linear", data=diamonds)