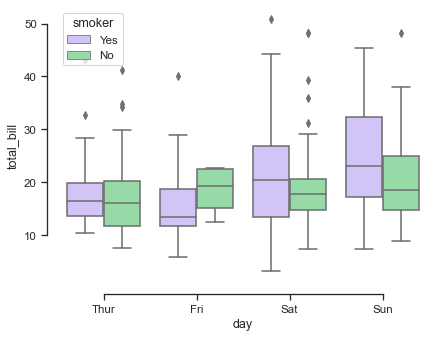
Grouped boxplots
seaborn components used: set_theme(), load_dataset(), boxplot(), despine()
import seaborn as sns
sns.set_theme(style="ticks", palette="pastel")

# Load the example tips dataset
tips = sns.load_dataset("tips")

# Draw a nested boxplot to show bills by day and time
sns.boxplot(x="day", y="total_bill",
            hue="smoker", palette=["m", "g"],
            data=tips)
sns.despine(offset=10, trim=True)