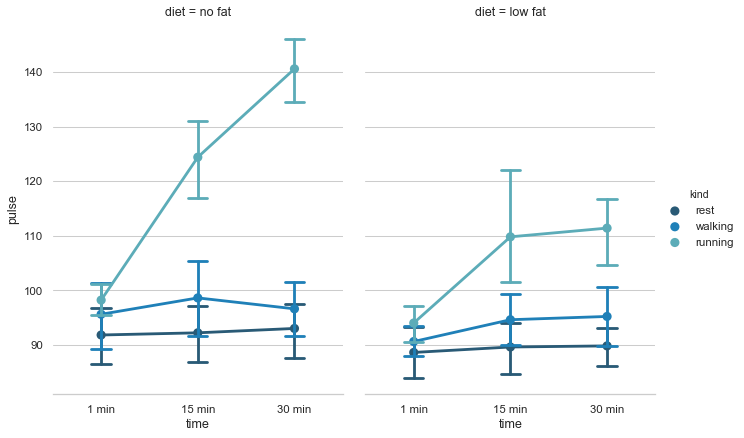
Plotting a three-way ANOVA
Python source code: [download source: pointplot_anova.py]
import seaborn as sns
sns.set(style="whitegrid")

# Load the example exercise dataset
df = sns.load_dataset("exercise")

# Draw a pointplot to show pulse as a function of three categorical factors
g = sns.catplot(x="time", y="pulse", hue="kind", col="diet",
                capsize=.2, palette="YlGnBu_d", height=6, aspect=.75,
                kind="point", data=df)
g.despine(left=True)