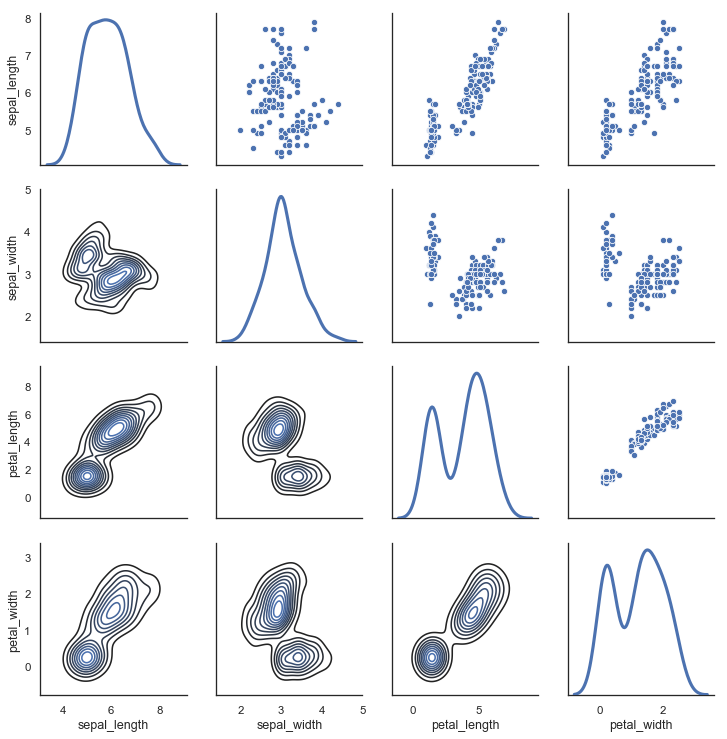
Paired density and scatterplot matrix
Python source code: [download source: pair_grid_with_kde.py]
import seaborn as sns
sns.set(style="white")

df = sns.load_dataset("iris")

g = sns.PairGrid(df, diag_sharey=False)
g.map_lower(sns.kdeplot)
g.map_upper(sns.scatterplot)
g.map_diag(sns.kdeplot, lw=3)