Multiple linear regression
Python source code: [download source: multiple_regression.py]
import seaborn as sns
sns.set()
# Load the iris dataset
iris = sns.load_dataset("iris")
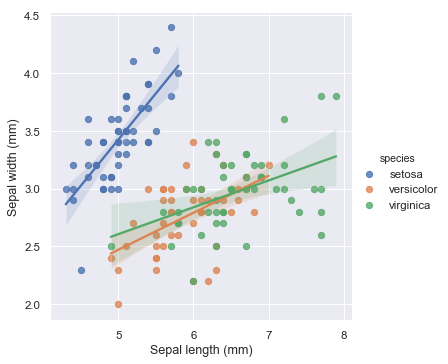
# Plot sepal with as a function of sepal_length across days
g = sns.lmplot(x="sepal_length", y="sepal_width", hue="species",
truncate=True, height=5, data=iris)
# Use more informative axis labels than are provided by default
g.set_axis_labels("Sepal length (mm)", "Sepal width (mm)")