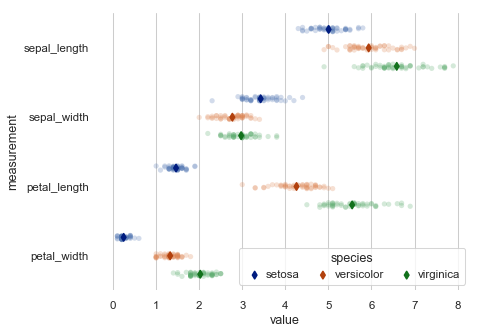
Conditional means with observations
Python source code: [download source: jitter_stripplot.py]
import pandas as pd
import seaborn as sns
import matplotlib.pyplot as plt

sns.set(style="whitegrid")
iris = sns.load_dataset("iris")

# "Melt" the dataset to "long-form" or "tidy" representation
iris = pd.melt(iris, "species", var_name="measurement")

# Initialize the figure
f, ax = plt.subplots()
sns.despine(bottom=True, left=True)

# Show each observation with a scatterplot
sns.stripplot(x="value", y="measurement", hue="species",
              data=iris, dodge=True, jitter=True,
              alpha=.25, zorder=1)

# Show the conditional means
sns.pointplot(x="value", y="measurement", hue="species",
              data=iris, dodge=.532, join=False, palette="dark",
              markers="d", scale=.75, ci=None)

# Improve the legend
handles, labels = ax.get_legend_handles_labels()
ax.legend(handles[3:], labels[3:], title="species",
          handletextpad=0, columnspacing=1,
          loc="lower right", ncol=3, frameon=True)