seaborn.rugplot(x=None, *, height=0.025, axis=None, ax=None, data=None, y=None, hue=None, palette=None, hue_order=None, hue_norm=None, expand_margins=True, legend=True, a=None, **kwargs)¶Plot marginal distributions by drawing ticks along the x and y axes.
This function is intended to complement other plots by showing the location of individual observations in an unobstrusive way.
dataVariables that specify positions on the x and y axes.
Proportion of axes extent covered by each rug element.
Axis to draw the rug on.
Deprecated since version 0.11.0: specify axis by assigning the x or y variables.
matplotlib.axes.AxesPre-existing axes for the plot. Otherwise, call matplotlib.pyplot.gca()
internally.
pandas.DataFrame, numpy.ndarray, mapping, or sequenceInput data structure. Either a long-form collection of vectors that can be assigned to named variables or a wide-form dataset that will be internally reshaped.
dataSemantic variable that is mapped to determine the color of plot elements.
matplotlib.colors.ColormapMethod for choosing the colors to use when mapping the hue semantic.
String values are passed to color_palette(). List or dict values
imply categorical mapping, while a colormap object implies numeric mapping.
Specify the order of processing and plotting for categorical levels of the
hue semantic.
matplotlib.colors.NormalizeEither a pair of values that set the normalization range in data units or an object that will map from data units into a [0, 1] interval. Usage implies numeric mapping.
If True, increase the axes margins by the height of the rug to avoid overlap with other elements.
If False, do not add a legend for semantic variables.
Other keyword arguments are passed to
matplotlib.collections.LineCollection()
matplotlib.axes.AxesThe matplotlib axes containing the plot.
Examples
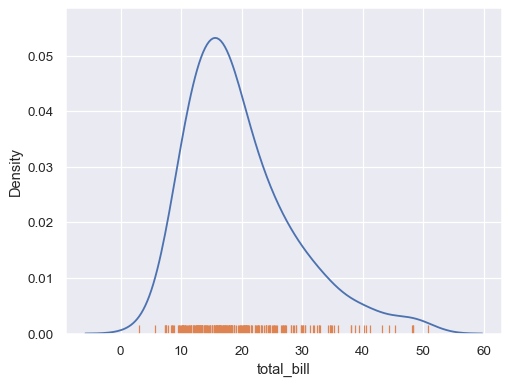
Add a rug along one of the axes:
import seaborn as sns; sns.set_theme()
tips = sns.load_dataset("tips")
sns.kdeplot(data=tips, x="total_bill")
sns.rugplot(data=tips, x="total_bill")
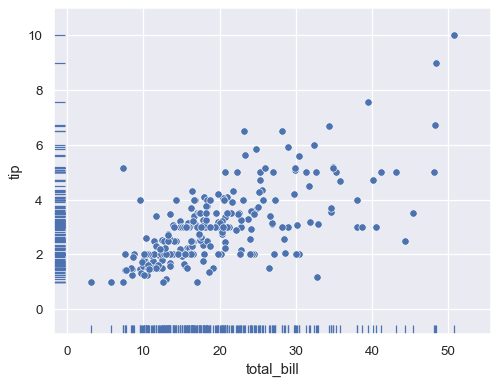
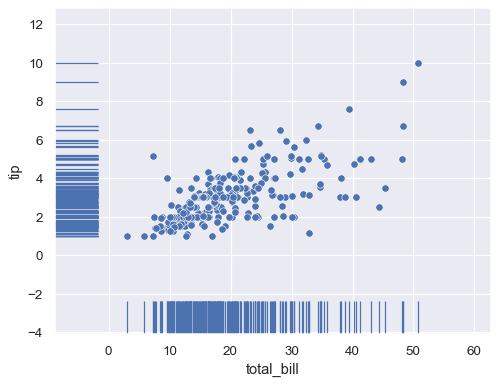
Add a rug along both axes:
sns.scatterplot(data=tips, x="total_bill", y="tip")
sns.rugplot(data=tips, x="total_bill", y="tip")
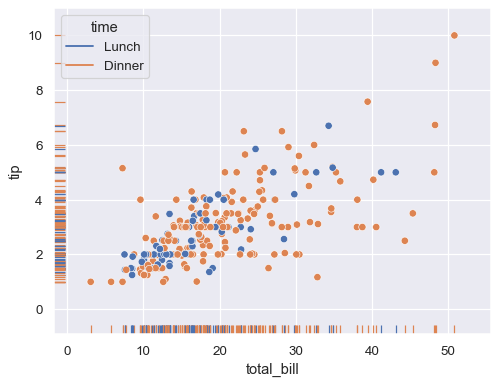
Represent a third variable with hue mapping:
sns.scatterplot(data=tips, x="total_bill", y="tip", hue="time")
sns.rugplot(data=tips, x="total_bill", y="tip", hue="time")
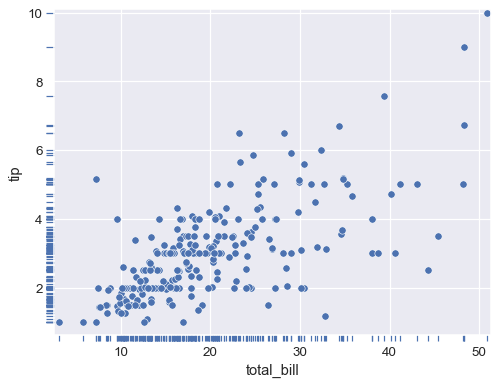
Draw a taller rug:
sns.scatterplot(data=tips, x="total_bill", y="tip")
sns.rugplot(data=tips, x="total_bill", y="tip", height=.1)
Put the rug outside the axes:
sns.scatterplot(data=tips, x="total_bill", y="tip")
sns.rugplot(data=tips, x="total_bill", y="tip", height=-.02, clip_on=False)
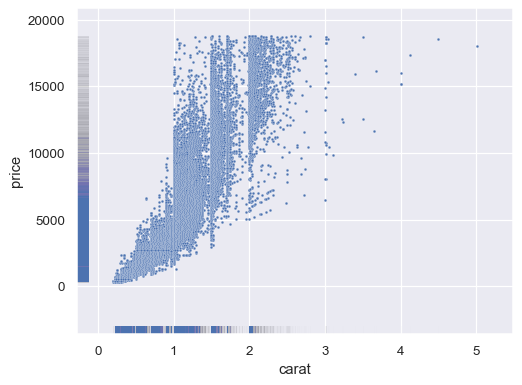
Show the density of a larger dataset using thinner lines and alpha blending:
diamonds = sns.load_dataset("diamonds")
sns.scatterplot(data=diamonds, x="carat", y="price", s=5)
sns.rugplot(data=diamonds, x="carat", y="price", lw=1, alpha=.005)