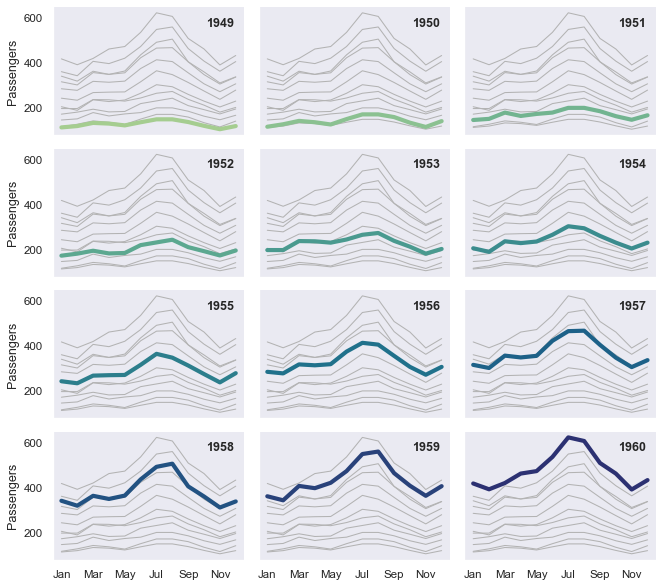
Small multiple time series
seaborn components used: set_theme(), load_dataset(), relplot(), lineplot()
import seaborn as sns

sns.set_theme(style="dark")
flights = sns.load_dataset("flights")

# Plot each year's time series in its own facet
g = sns.relplot(
    data=flights,
    x="month", y="passengers", col="year", hue="year",
    kind="line", palette="crest", linewidth=4, zorder=5,
    col_wrap=3, height=2, aspect=1.5, legend=False,
)

# Iterate over each subplot to customize further
for year, ax in g.axes_dict.items():

    # Add the title as an annotation within the plot
    ax.text(.8, .85, year, transform=ax.transAxes, fontweight="bold")

    # Plot every year's time series in the background
    sns.lineplot(
        data=flights, x="month", y="passengers", units="year",
        estimator=None, color=".7", linewidth=1, ax=ax,
    )

# Reduce the frequency of the x axis ticks
ax.set_xticks(ax.get_xticks()[::2])

# Tweak the supporting aspects of the plot
g.set_titles("")
g.set_axis_labels("", "Passengers")
g.tight_layout()