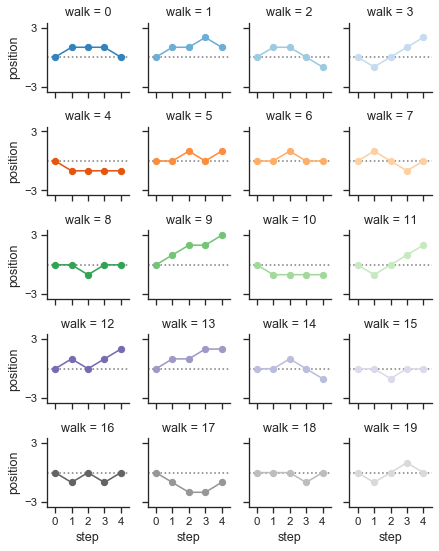
Plotting on a large number of facets
Python source code: [download source: many_facets.py]
import numpy as np
import pandas as pd
import seaborn as sns
import matplotlib.pyplot as plt

sns.set(style="ticks")

# Create a dataset with many short random walks
rs = np.random.RandomState(4)
pos = rs.randint(-1, 2, (20, 5)).cumsum(axis=1)
pos -= pos[:, 0, np.newaxis]
step = np.tile(range(5), 20)
walk = np.repeat(range(20), 5)
df = pd.DataFrame(np.c_[pos.flat, step, walk],
                  columns=["position", "step", "walk"])

# Initialize a grid of plots with an Axes for each walk
grid = sns.FacetGrid(df, col="walk", hue="walk", palette="tab20c",
                     col_wrap=4, height=1.5)

# Draw a horizontal line to show the starting point
grid.map(plt.axhline, y=0, ls=":", c=".5")

# Draw a line plot to show the trajectory of each random walk
grid.map(plt.plot, "step", "position", marker="o")

# Adjust the tick positions and labels
grid.set(xticks=np.arange(5), yticks=[-3, 3],
         xlim=(-.5, 4.5), ylim=(-3.5, 3.5))

# Adjust the arrangement of the plots
grid.fig.tight_layout(w_pad=1)